QUESTION IMAGE
Question
question
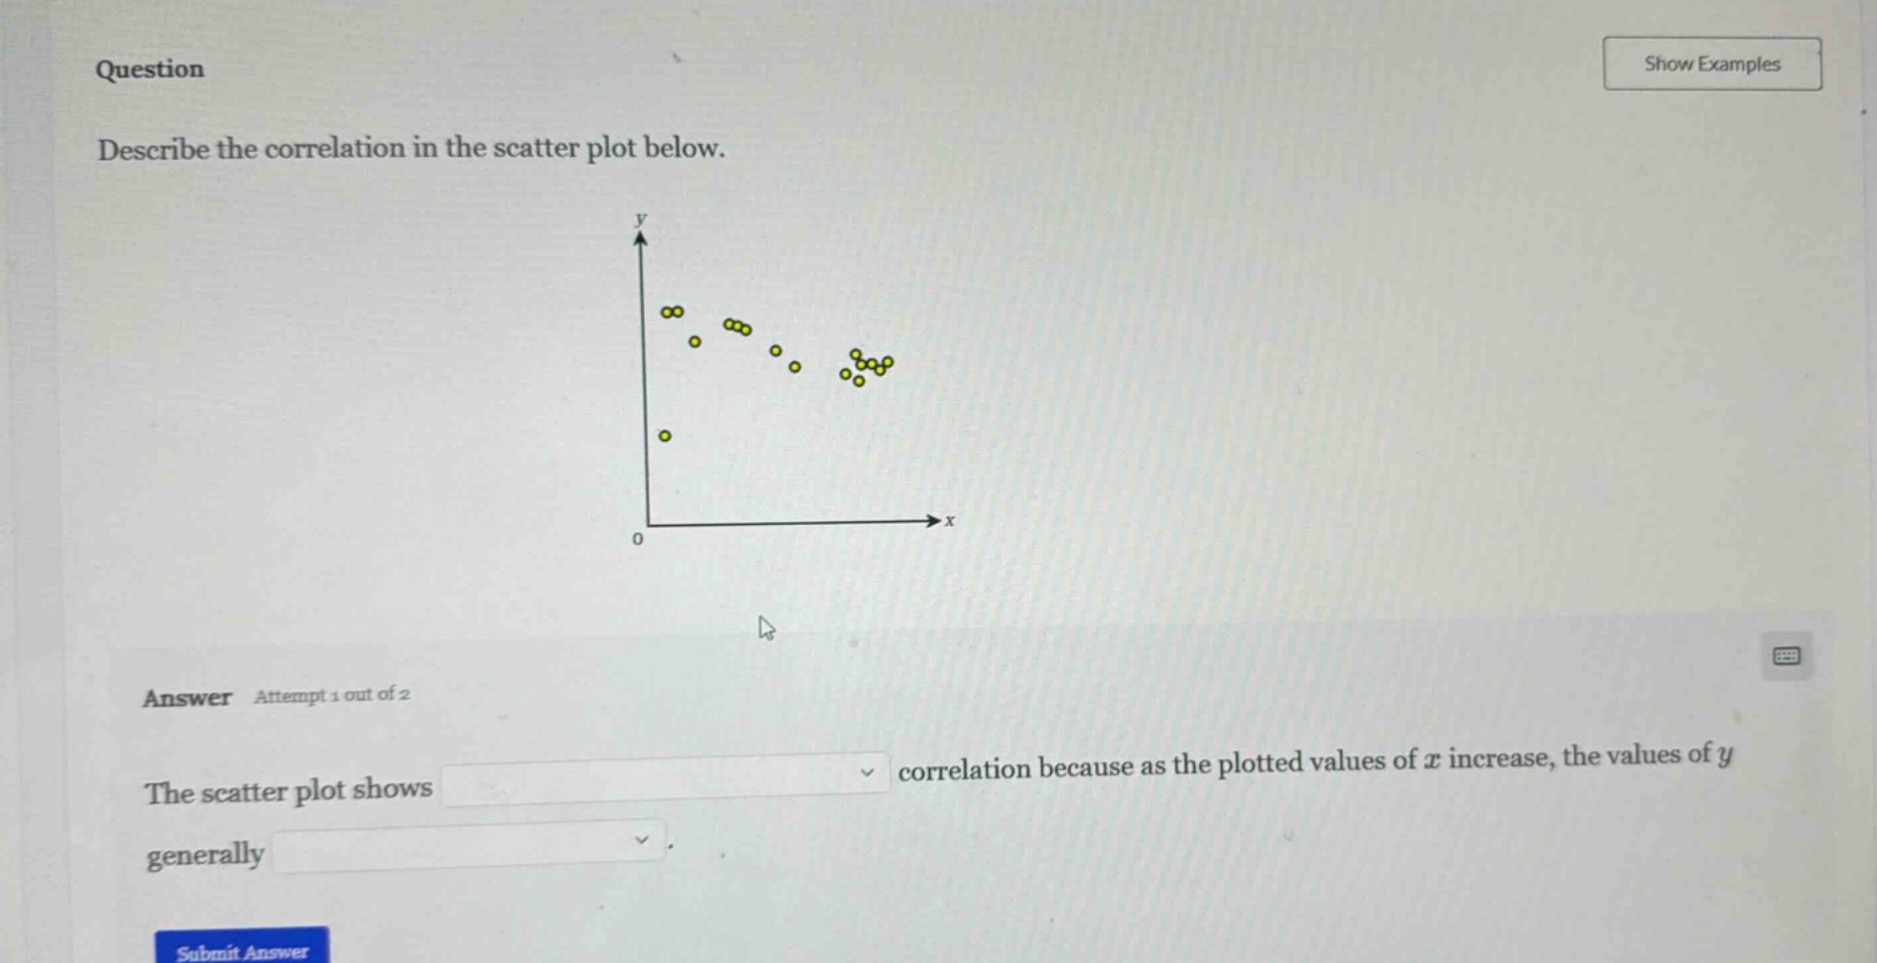
describe the correlation in the scatter plot below.
answer attempt 1 out of 2
the scatter plot shows correlation because as the plotted values of ( x ) increase, the values of ( y ) generally .
To determine the correlation, we analyze the trend of the points. As \( x \) (horizontal axis) increases, the \( y \) (vertical axis) values tend to decrease, and the points show a somewhat consistent downward trend (though not perfectly linear, it's a negative association). So the correlation is negative, and \( y \) generally decreases as \( x \) increases.

Snap & solve any problem in the app
Get step-by-step solutions on Sovi AI
Photo-based solutions with guided steps
Explore more problems and detailed explanations
The scatter plot shows \(\boldsymbol{\text{negative}}\) correlation because as the plotted values of \( x \) increase, the values of \( y \) generally \(\boldsymbol{\text{decrease}}\).