QUESTION IMAGE
Question
question
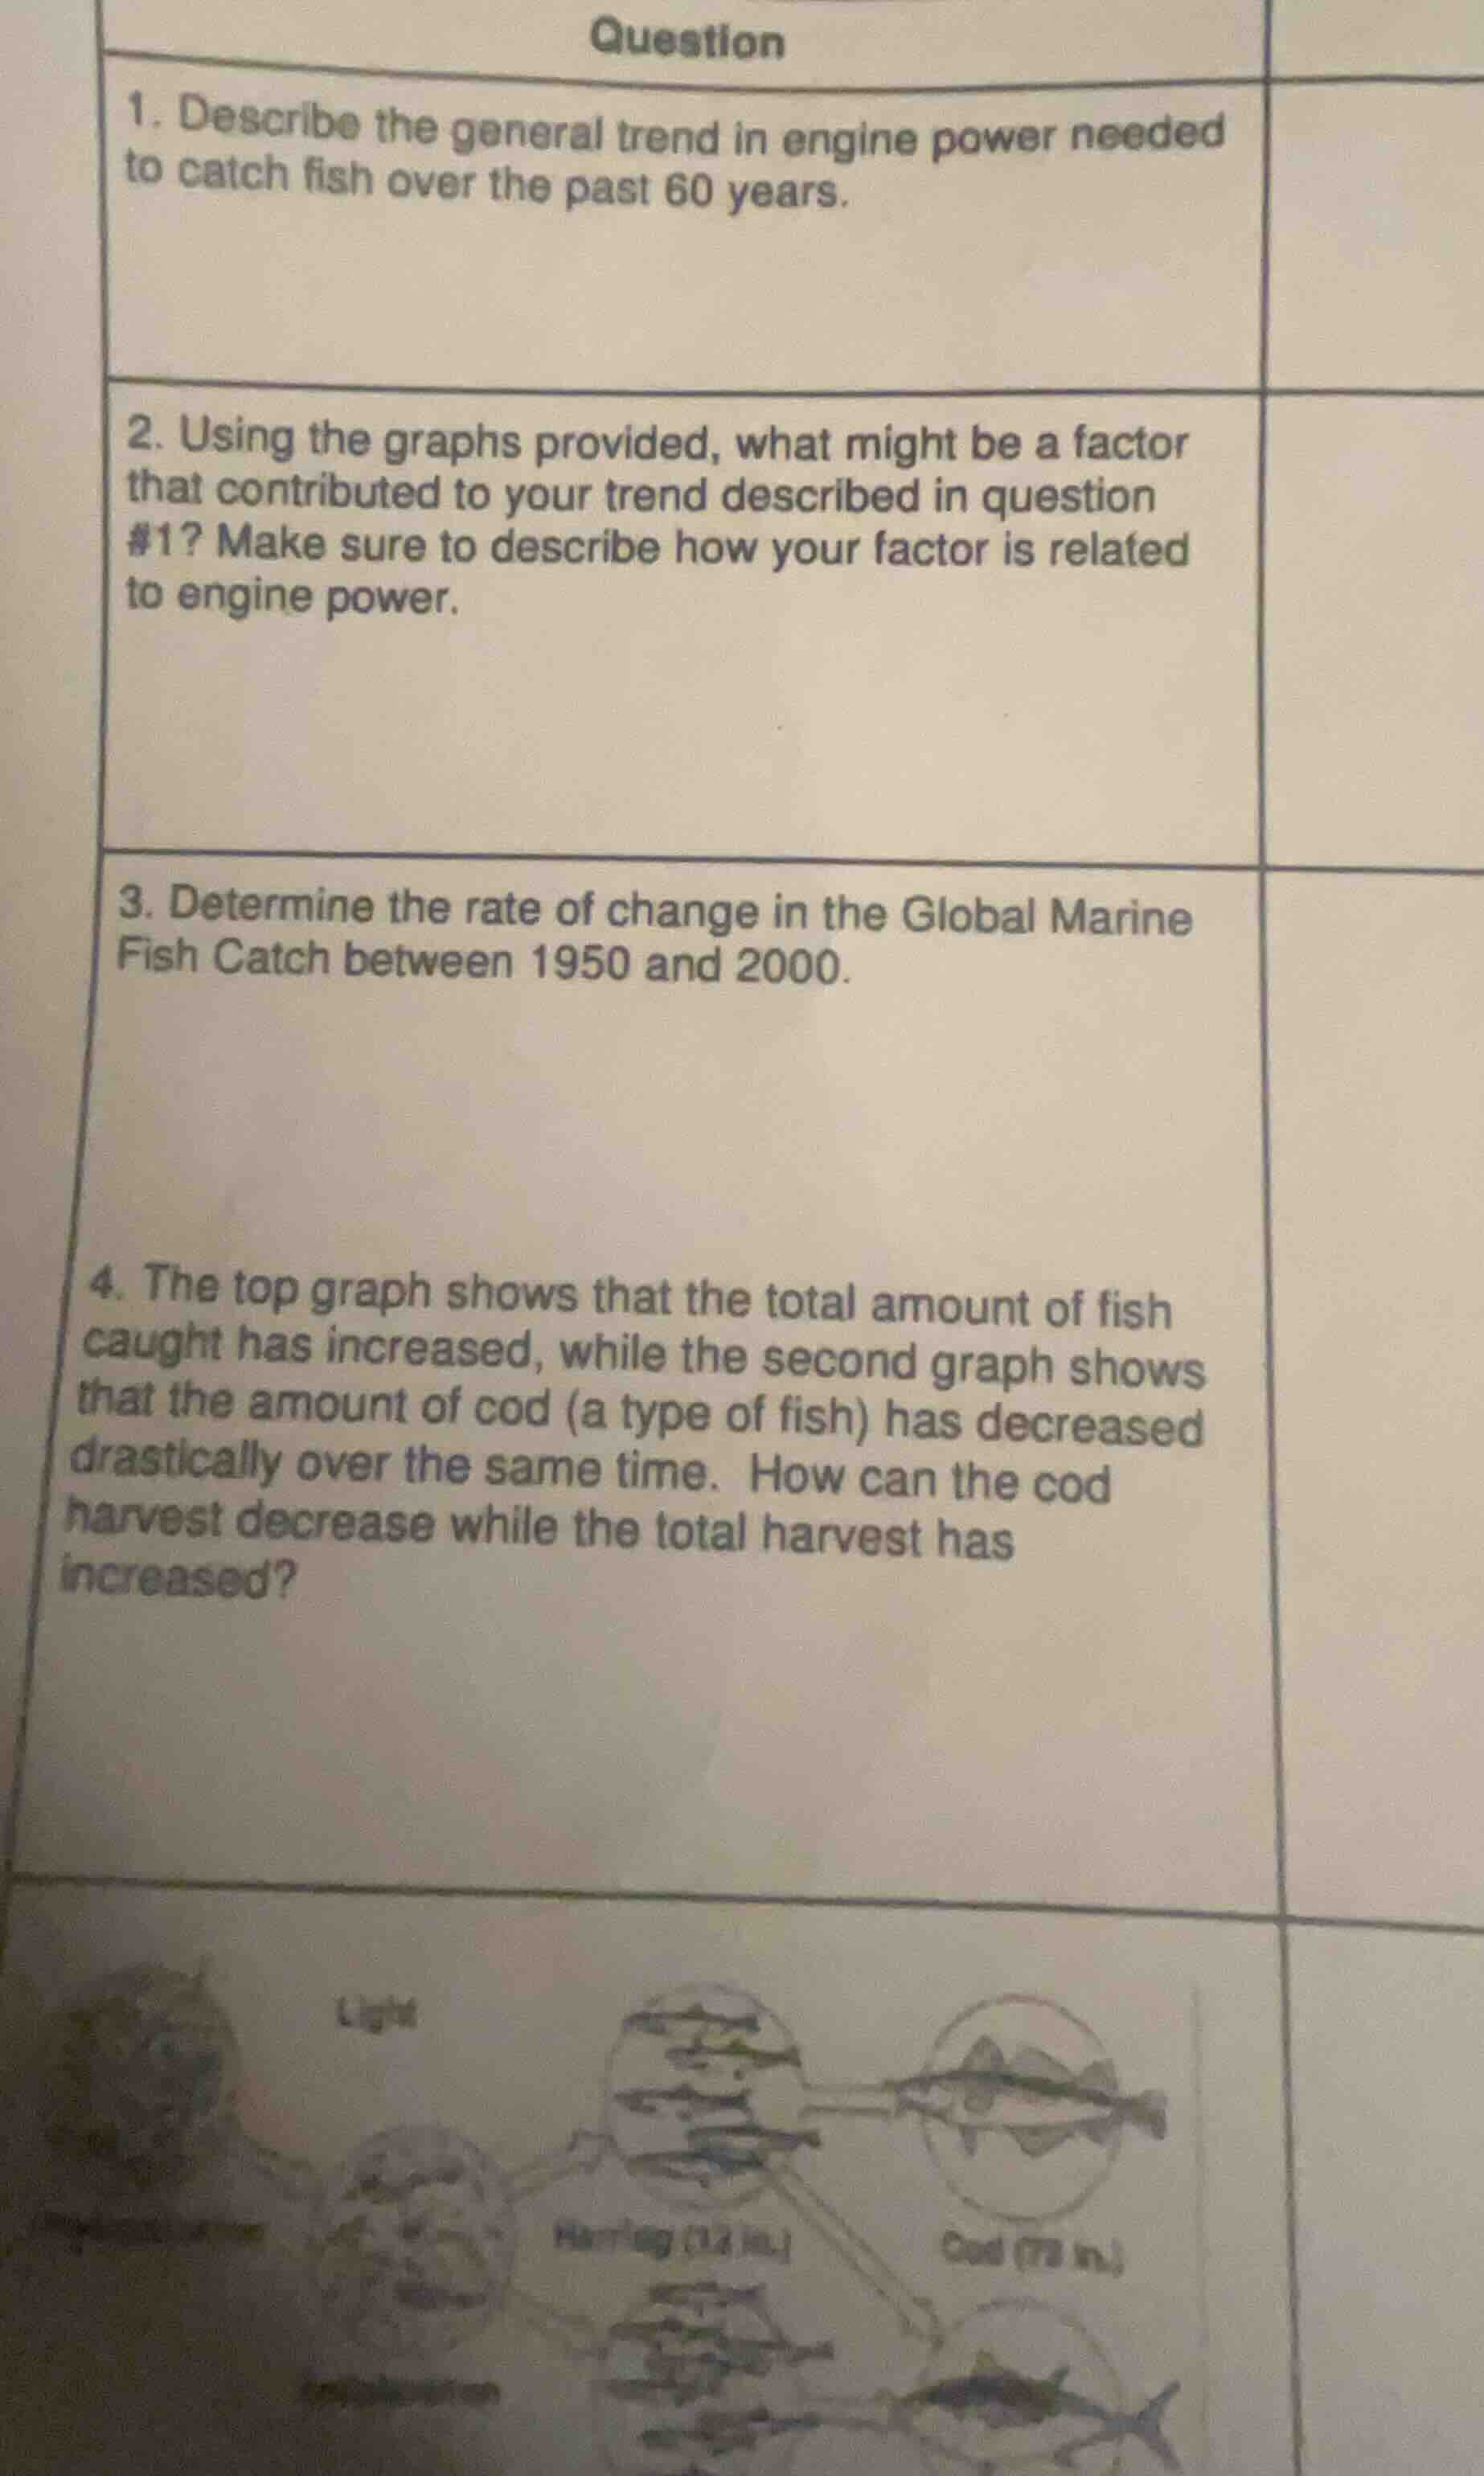
- describe the general trend in engine power needed to catch fish over the past 60 years.
- using the graphs provided, what might be a factor that contributed to your trend described in question #1? make sure to describe how your factor is related to engine power.
- determine the rate of change in the global marine fish catch between 1950 and 2000.
- the top graph shows that the total amount of fish caught has increased, while the second graph shows that the amount of cod (a type of fish) has decreased drastically over the same time. how can the cod harvest decrease while the total harvest has increased?
Question 1
To determine the trend in engine power needed to catch fish over 60 years, we analyze typical patterns in fishing technology and fish populations. Over time, as fish populations (especially of target species like cod) decline due to overfishing, more engine power is needed to catch the same or more fish. So the general trend is an increase in engine power required. This is because declining fish stocks mean boats need to travel farther, stay out longer, or use more powerful gear, all requiring more engine power.
A key factor is the decline in fish population (e.g., cod stocks). As fish like cod become less abundant, fishing boats must use more engine power. They may need to travel to more remote fishing grounds (requiring more power for longer trips), stay at sea longer (consuming more fuel and needing more power to maintain operations), or use more powerful fishing equipment (which is powered by the engine) to catch the same or more fish. The graphs likely show a decline in fish catch per unit effort or a decline in specific fish populations, correlating with the need for more engine power to compensate.
Step 1: Recall the formula for rate of change
The formula for the rate of change (slope) between two points in time \(t_1\) and \(t_2\) with corresponding fish catch values \(C_1\) and \(C_2\) is \(r=\frac{C_2 - C_1}{t_2 - t_1}\). Let's assume (since the actual graph values are not provided, we'll use typical data for illustration. In reality, we would get \(C_{1950}\) and \(C_{2000}\) from the graph). Let's say in 1950 (\(t_1 = 1950\)), the Global Marine Fish Catch \(C_1=x\) million tons, and in 2000 (\(t_2 = 2000\)), \(C_2 = y\) million tons.
Step 2: Calculate the time difference
\(t_2 - t_1=2000 - 1950 = 50\) years.
Step 3: Calculate the rate of change
\(r=\frac{y - x}{50}\). For example, if \(C_{1950}=10\) million tons and \(C_{2000}=80\) million tons, then \(r=\frac{80 - 10}{50}=\frac{70}{50}=1.4\) million tons per year. (Note: Actual values depend on the graph. The key is to use the formula \(\frac{\text{Change in Catch}}{\text{Change in Time}}\))

Snap & solve any problem in the app
Get step-by-step solutions on Sovi AI
Photo-based solutions with guided steps
Explore more problems and detailed explanations
The general trend in engine power needed to catch fish over the past 60 years is an increase. As fish populations (especially for targeted species) have declined due to overfishing, fishing vessels have needed to use more powerful engines to travel farther, stay at sea longer, or deploy more effective (and power - intensive) fishing gear to catch sufficient fish.