QUESTION IMAGE
Question
question
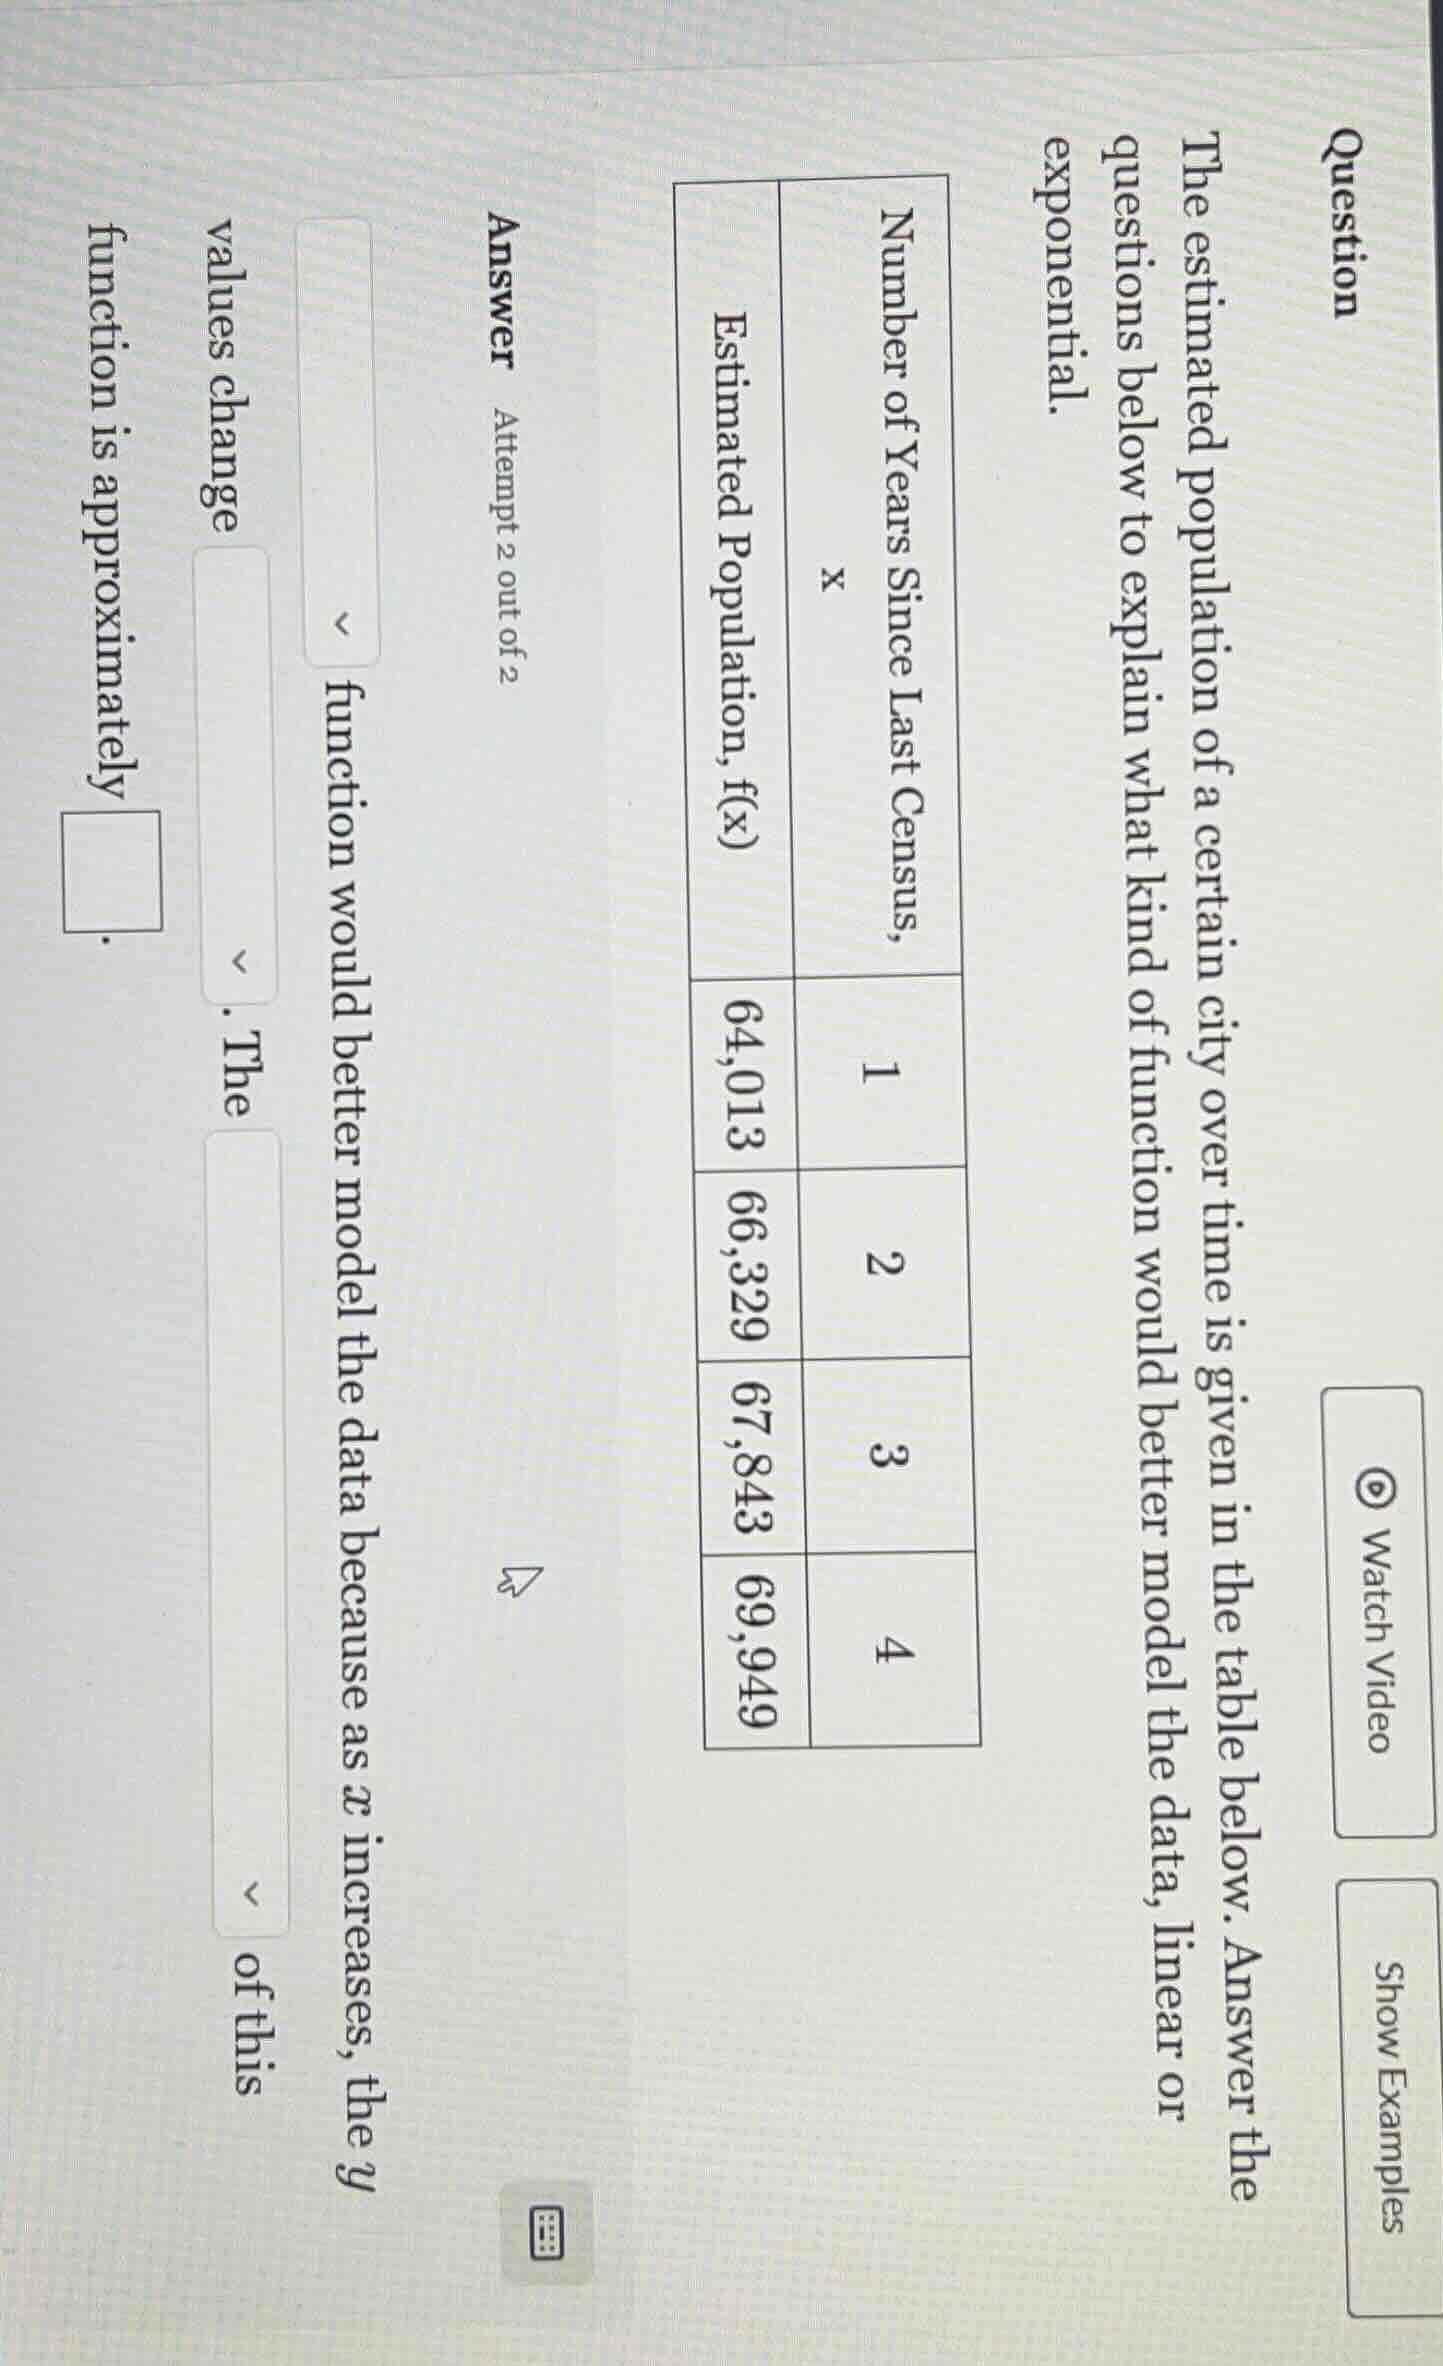
the estimated population of a certain city over time is given in the table below. answer the questions below to explain what kind of function would better model the data, linear or exponential.
| number of years since last census, x | estimated population, f(x) | ---- | ---- | 1 | 64,013 | 2 | 66,329 | 3 | 67,843 | 4 | 69,949 | answer attempt 2 out of 2__ function would better model the data because as $x$ increases, the $y$ values change . the of this function is approximately __. |
Step1: Calculate linear differences
$66,329 - 64,013 = 2,316$
$67,843 - 66,329 = 1,514$
$69,949 - 67,843 = 2,106$
Step2: Calculate exponential growth factors
$\frac{66,329}{64,013} \approx 1.036$
$\frac{67,843}{66,329} \approx 1.023$
$\frac{69,949}{67,843} \approx 1.031$
Step3: Compare consistency
Linear differences vary widely; exponential growth factors are close (around 1.03).

Snap & solve any problem in the app
Get step-by-step solutions on Sovi AI
Photo-based solutions with guided steps
Explore more problems and detailed explanations
Linear function would better model the data because as $x$ increases, the $y$ values change by approximately constant differences. The average rate of change (slope) of this function is approximately $\frac{69,949 - 64,013}{4-1} = \frac{5,936}{3} \approx 1,979$.
Note: While exponential growth factors are relatively consistent, the linear differences, despite minor variation, are more aligned with a near-constant rate, and the average slope provides a reasonable linear model fit for the given data.