QUESTION IMAGE
Question
question
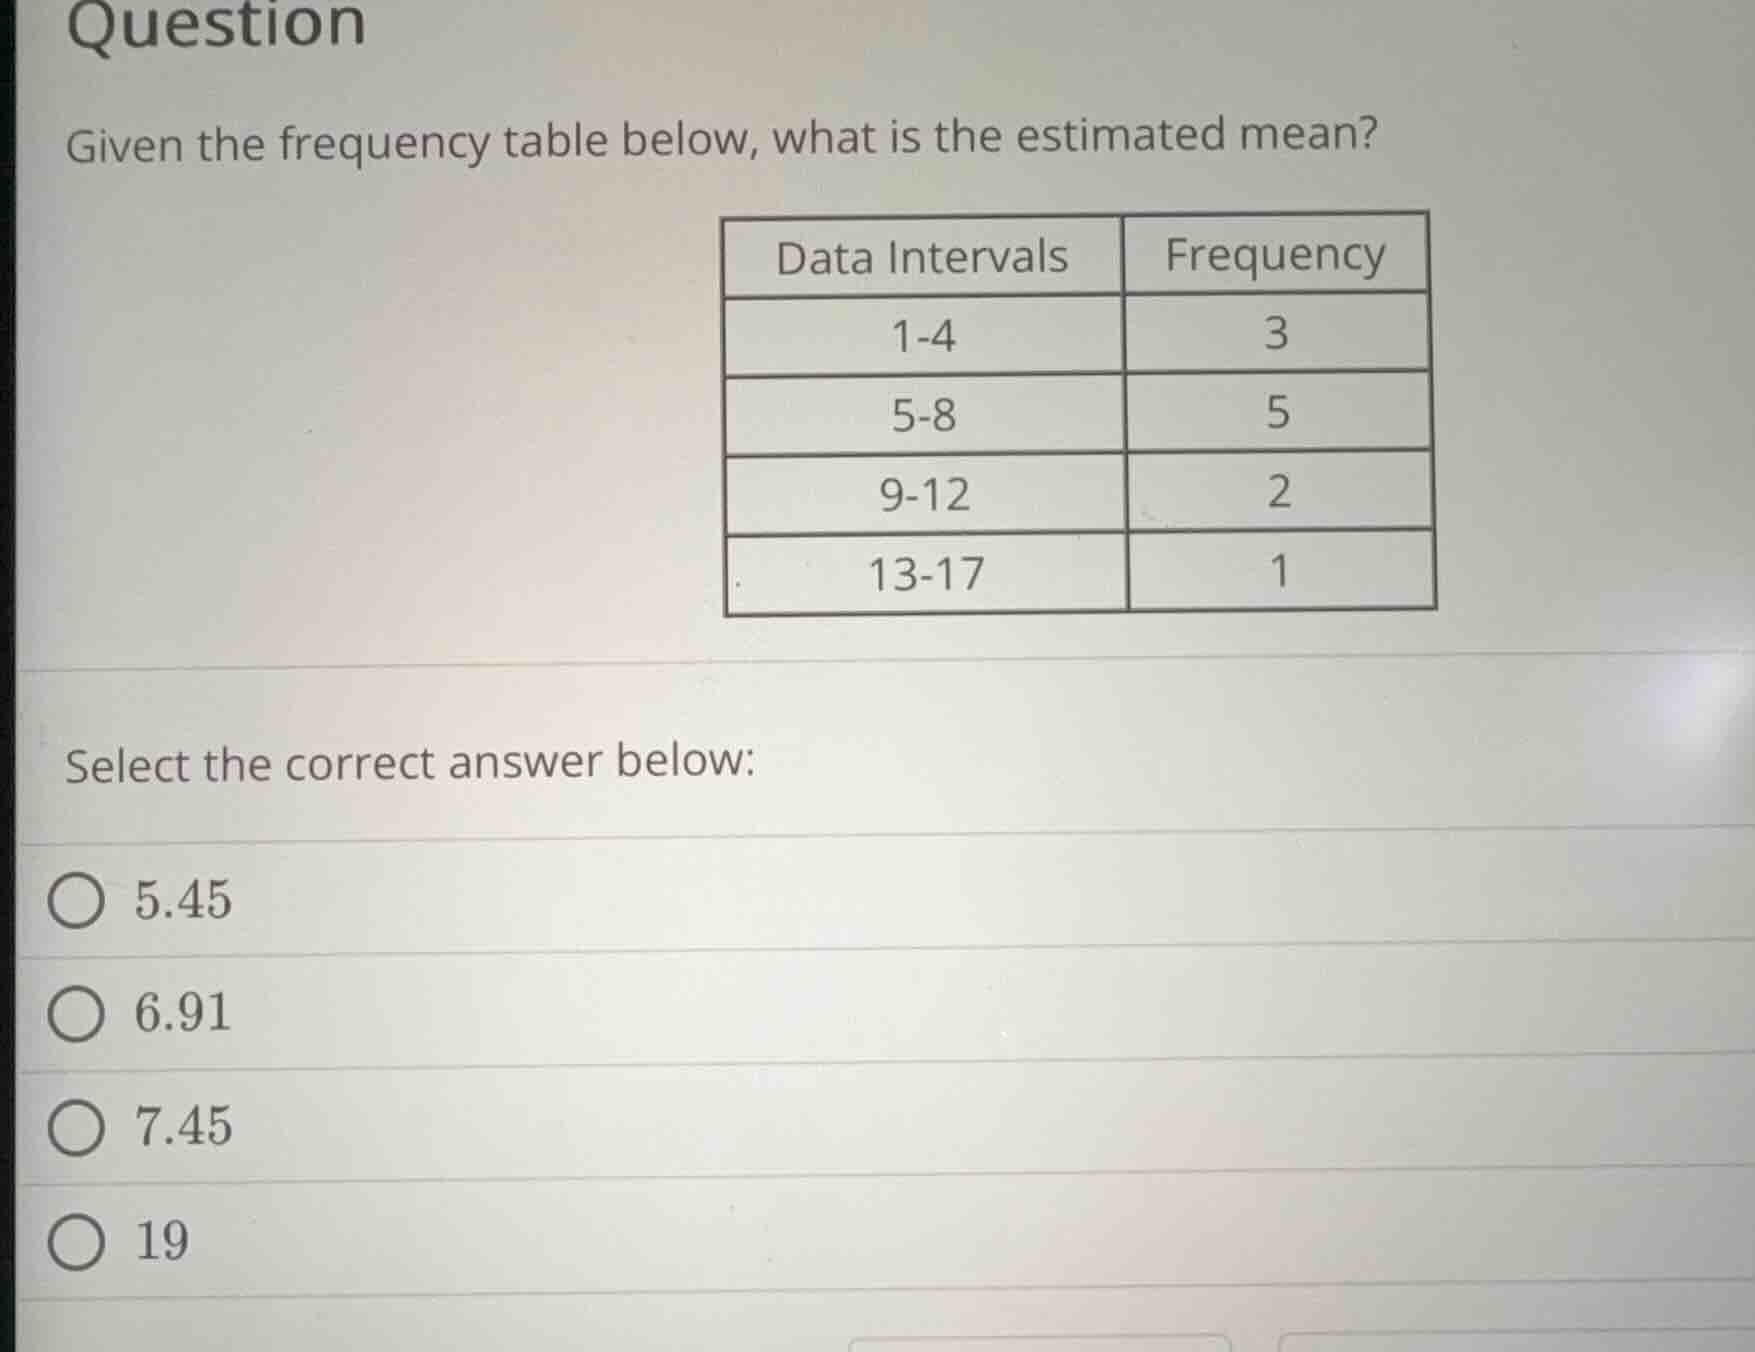
given the frequency table below, what is the estimated mean?
data intervals frequency
1-4 3
5-8 5
9-12 2
13-17 1
select the correct answer below:
○ 5.45
○ 6.91
○ 7.45
○ 19
Step1: Find midpoints of intervals
For \(1 - 4\), midpoint \(x_1=\frac{1 + 4}{2}=2.5\)
For \(5 - 8\), midpoint \(x_2=\frac{5 + 8}{2}=6.5\)
For \(9 - 12\), midpoint \(x_3=\frac{9 + 12}{2}=10.5\)
For \(13 - 17\), midpoint \(x_4=\frac{13 + 17}{2}=15\)
Step2: Calculate \(f_i\times x_i\) for each interval
- For \(1 - 4\): \(f_1\times x_1 = 3\times2.5 = 7.5\)
- For \(5 - 8\): \(f_2\times x_2 = 5\times6.5 = 32.5\)
- For \(9 - 12\): \(f_3\times x_3 = 2\times10.5 = 21\)
- For \(13 - 17\): \(f_4\times x_4 = 1\times15 = 15\)
Step3: Find total of \(f_i\times x_i\) and total frequency
Total \(f_i\times x_i=7.5 + 32.5+21 + 15=76\)
Total frequency \(N = 3 + 5+2 + 1=11\)
Step4: Calculate estimated mean
Estimated mean \(=\frac{\sum f_i x_i}{N}=\frac{76}{11}\approx6.91\)

Snap & solve any problem in the app
Get step-by-step solutions on Sovi AI
Photo-based solutions with guided steps
Explore more problems and detailed explanations
6.91