QUESTION IMAGE
Question
question
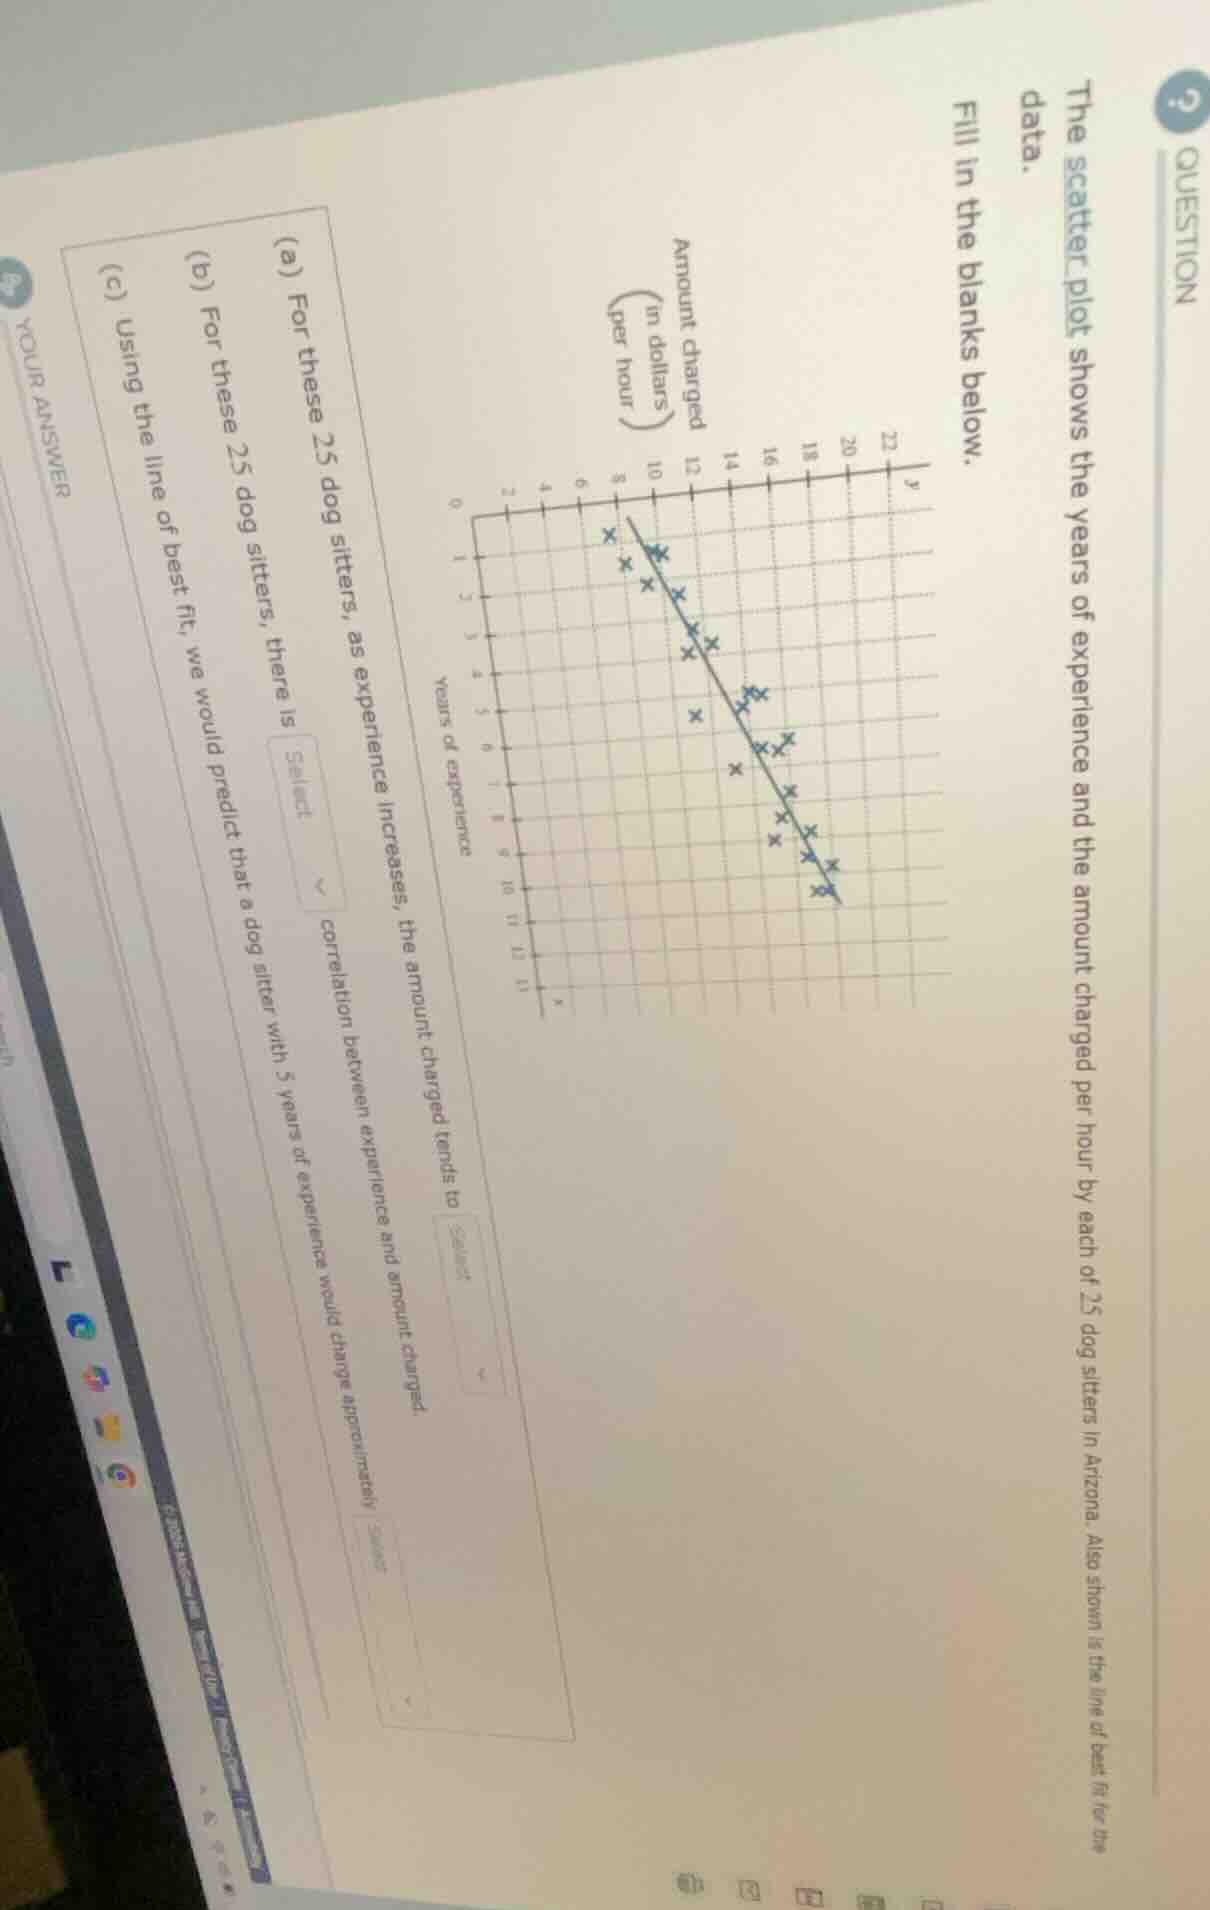
the scatter plot shows the years of experience and the amount charged per hour by each of 25 dog sitters in arizona. also shown is the line of best fit for the data.
fill in the blanks below.
(a) for these 25 dog sitters, as experience increases, the amount charged tends to select
(b) for these 25 dog sitters, there is select correlation between experience and amount charged.
(c) using the line of best fit, we would predict that a dog sitter with 5 years of experience would charge approximately select
Step1: Analyze trend in scatter plot
Observe that as x (years of experience) increases, y (amount charged) moves upward along the line of best fit.
Step2: Identify correlation type
The upward trend means as one variable increases, the other increases, which is a positive correlation.
Step3: Predict value from line of best fit
Find x=5 on the x-axis, move up to the line of best fit, then read the corresponding y-value, which is 12.

Snap & solve any problem in the app
Get step-by-step solutions on Sovi AI
Photo-based solutions with guided steps
Explore more problems and detailed explanations
(a) increase
(b) positive
(c) $\$12$