QUESTION IMAGE
Question
question 4 of 5
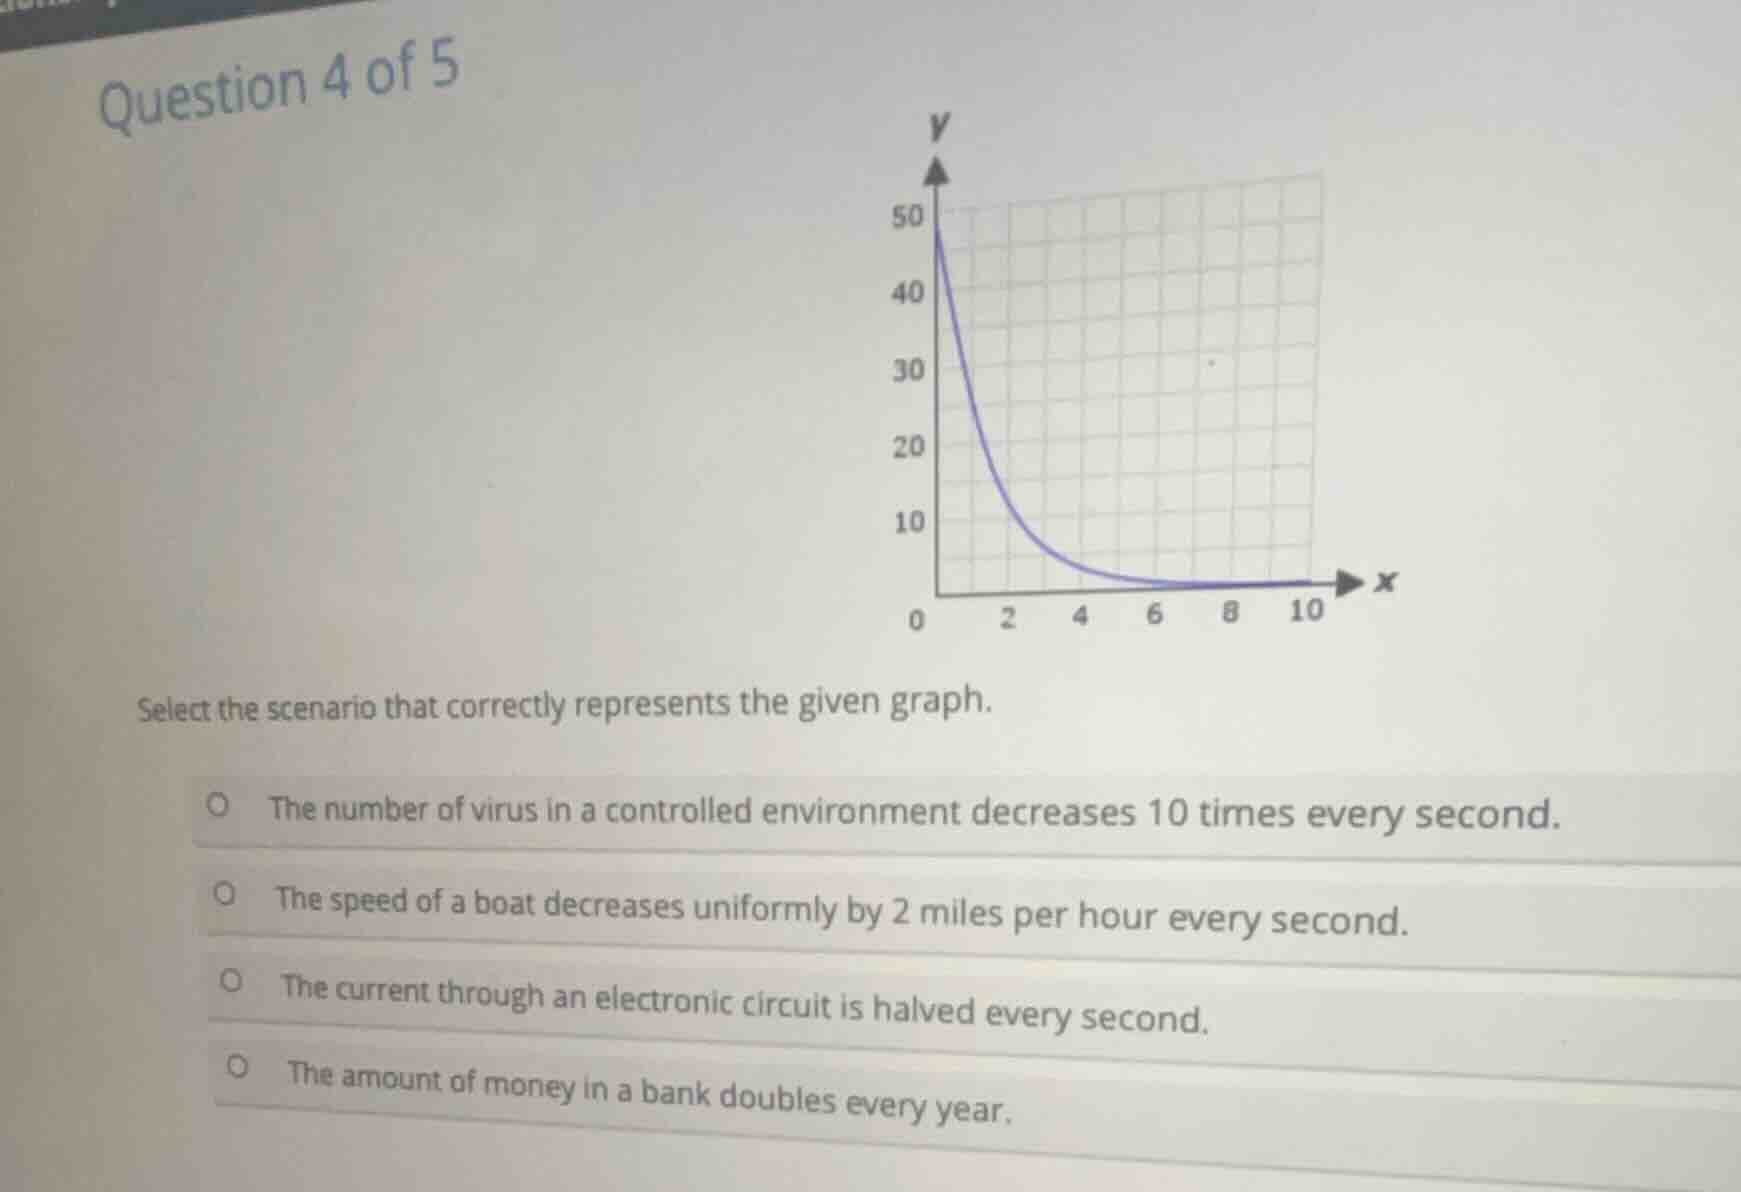
select the scenario that correctly represents the given graph.
○ the number of virus in a controlled environment decreases 10 times every second.
○ the speed of a boat decreases uniformly by 2 miles per hour every second.
○ the current through an electronic circuit is halved every second.
○ the amount of money in a bank doubles every year.
Brief Explanations
- The graph shows an exponential decay curve: it starts at a high value, decreases rapidly at first, and the rate of decrease slows over time, approaching but never reaching 0.
- Analyze each option:
- Option 1: A 10-fold decrease every second would be an extremely rapid decay, far steeper than the graph shows.
- Option 2: A uniform decrease describes linear decay, which would be a straight line, not the curved graph provided.
- Option 3: Being halved every second is exponential decay, which matches the shape of the curve (rapid initial decrease, slowing over time).
- Option 4: Doubling money describes exponential growth, which would be an increasing curve, not decreasing.

Snap & solve any problem in the app
Get step-by-step solutions on Sovi AI
Photo-based solutions with guided steps
Explore more problems and detailed explanations
The current through an electronic circuit is halved every second.