QUESTION IMAGE
Question
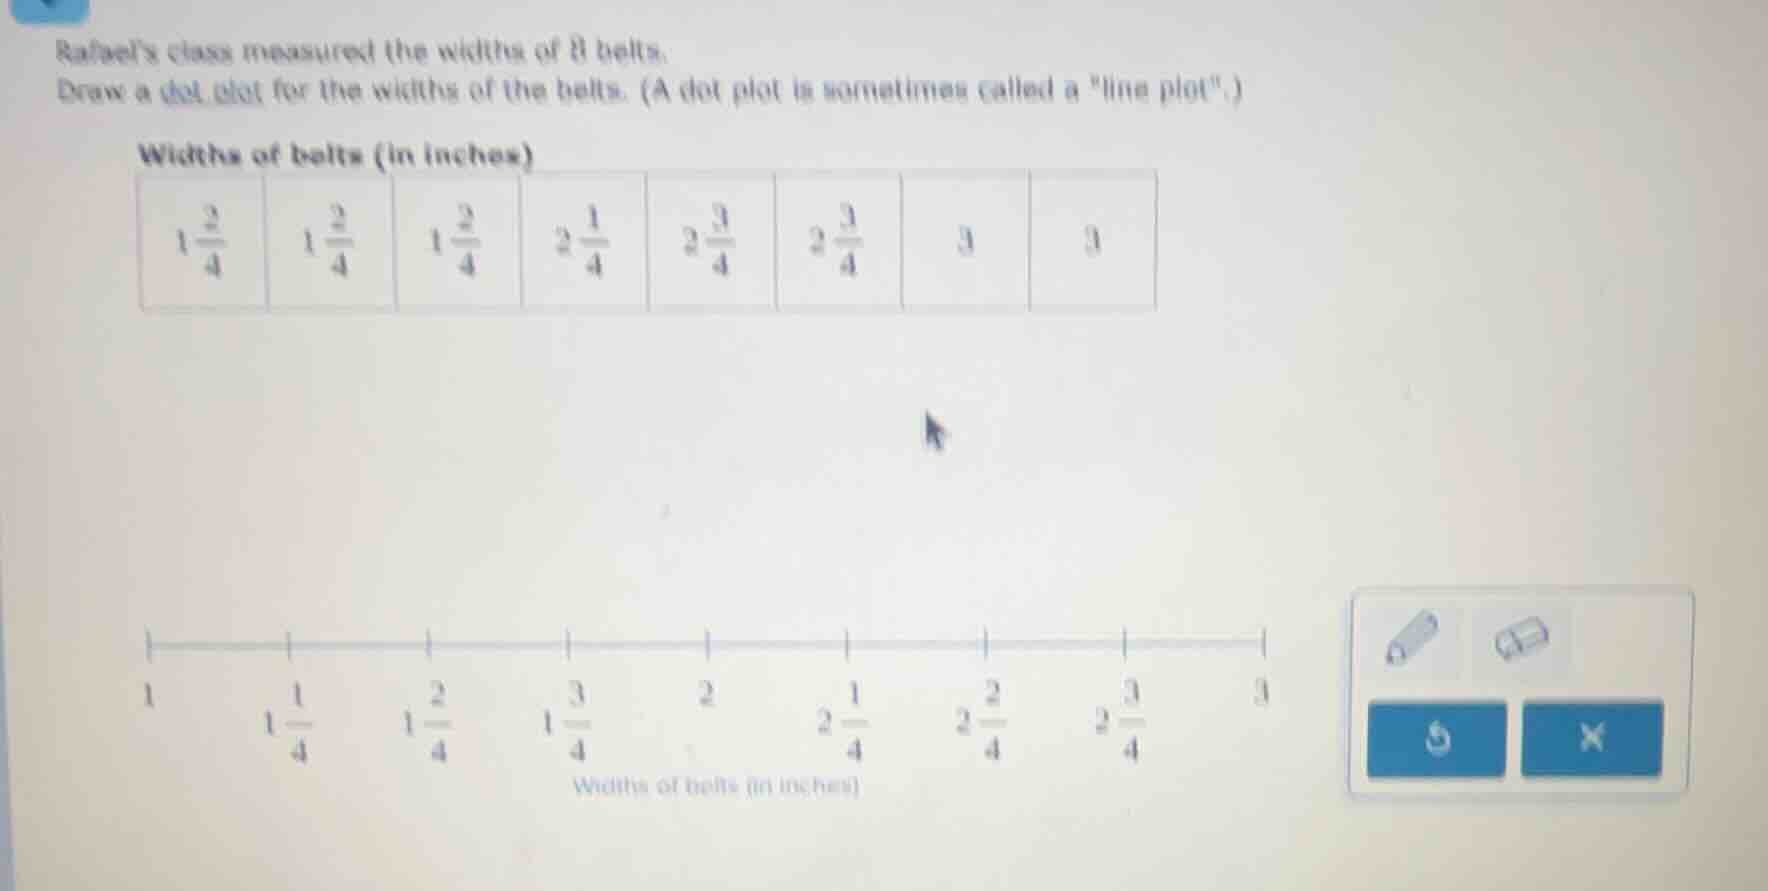
rafael’s class measured the widths of 8 belts.
draw a dot plot for the widths of the belts. (a dot plot is sometimes called a \line plot\.)
widths of belts (in inches)
$1\frac{2}{4}$ $1\frac{2}{4}$ $1\frac{2}{4}$ $2\frac{1}{4}$ $2\frac{3}{4}$ $2\frac{3}{4}$ $3$ $3$
number line with marks at 1, $1\frac{1}{4}$, $1\frac{2}{4}$, $1\frac{3}{4}$, 2, $2\frac{1}{4}$, $2\frac{2}{4}$, $2\frac{3}{4}$, 3, labeled \widths of belts (in inches)\
Step1: Count each width frequency
- $1\frac{2}{4}$: 3 occurrences
- $2\frac{1}{4}$: 1 occurrence
- $2\frac{3}{4}$: 2 occurrences
- $3$: 2 occurrences
Step2: Match to number line
Place dots above each value on the pre-drawn number line, with the number of dots equal to the frequency of each width.
- Above $1\frac{2}{4}$: Draw 3 dots
- Above $2\frac{1}{4}$: Draw 1 dot
- Above $2\frac{3}{4}$: Draw 2 dots
- Above $3$: Draw 2 dots

Snap & solve any problem in the app
Get step-by-step solutions on Sovi AI
Photo-based solutions with guided steps
Explore more problems and detailed explanations
A dot plot where:
- 3 dots are placed above $1\frac{2}{4}$
- 1 dot is placed above $2\frac{1}{4}$
- 2 dots are placed above $2\frac{3}{4}$
- 2 dots are placed above $3$
on the provided number line labeled "Widths of belts (in inches)".