QUESTION IMAGE
Question
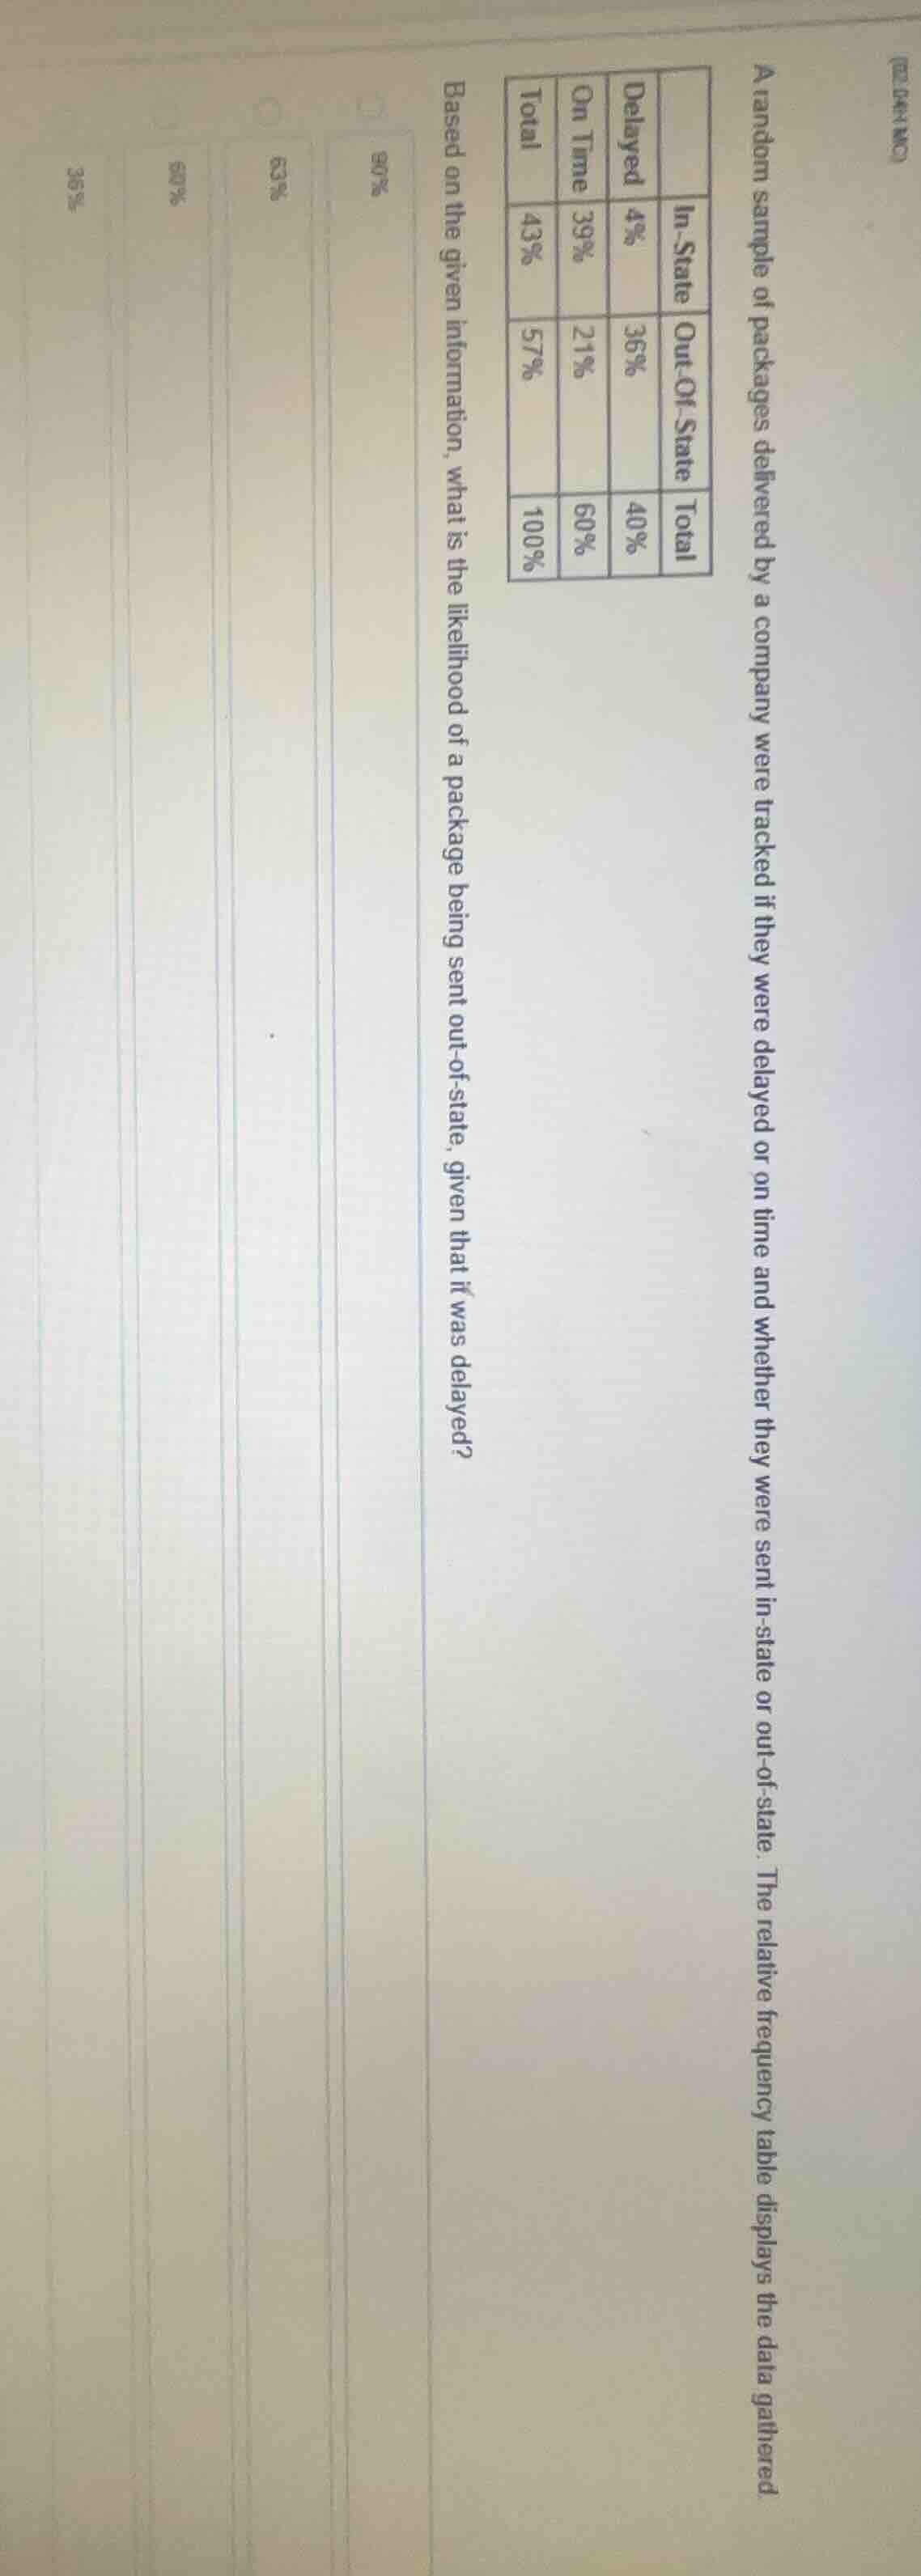
a random sample of packages delivered by a company were tracked if they were delayed or on time and whether they were sent in - state or out - of - state. the relative frequency table displays the data gathered.
| delayed | on time | total | |
|---|---|---|---|
| out - of - state | 36% | 21% | 57% |
| total | 40% | 60% | 100% |
based on the given information, what is the likelihood of a package being sent out - of - state, given that it was delayed?
options: 90%, 63%, 57%, 35%
Step1: Recall conditional probability formula
We use the formula for conditional probability: $P(\text{Out-of-State}|\text{Delayed}) = \frac{P(\text{Out-of-State and Delayed})}{P(\text{Delayed})}$
Step2: Identify values from the table
From the table, $P(\text{Out-of-State and Delayed}) = 36\%$, $P(\text{Delayed}) = 40\%$
Step3: Calculate the probability
Substitute values into the formula: $\frac{36\%}{40\%} = 0.9 = 90\%$

Snap & solve any problem in the app
Get step-by-step solutions on Sovi AI
Photo-based solutions with guided steps
Explore more problems and detailed explanations
90%