QUESTION IMAGE
Question
recognizing relationships
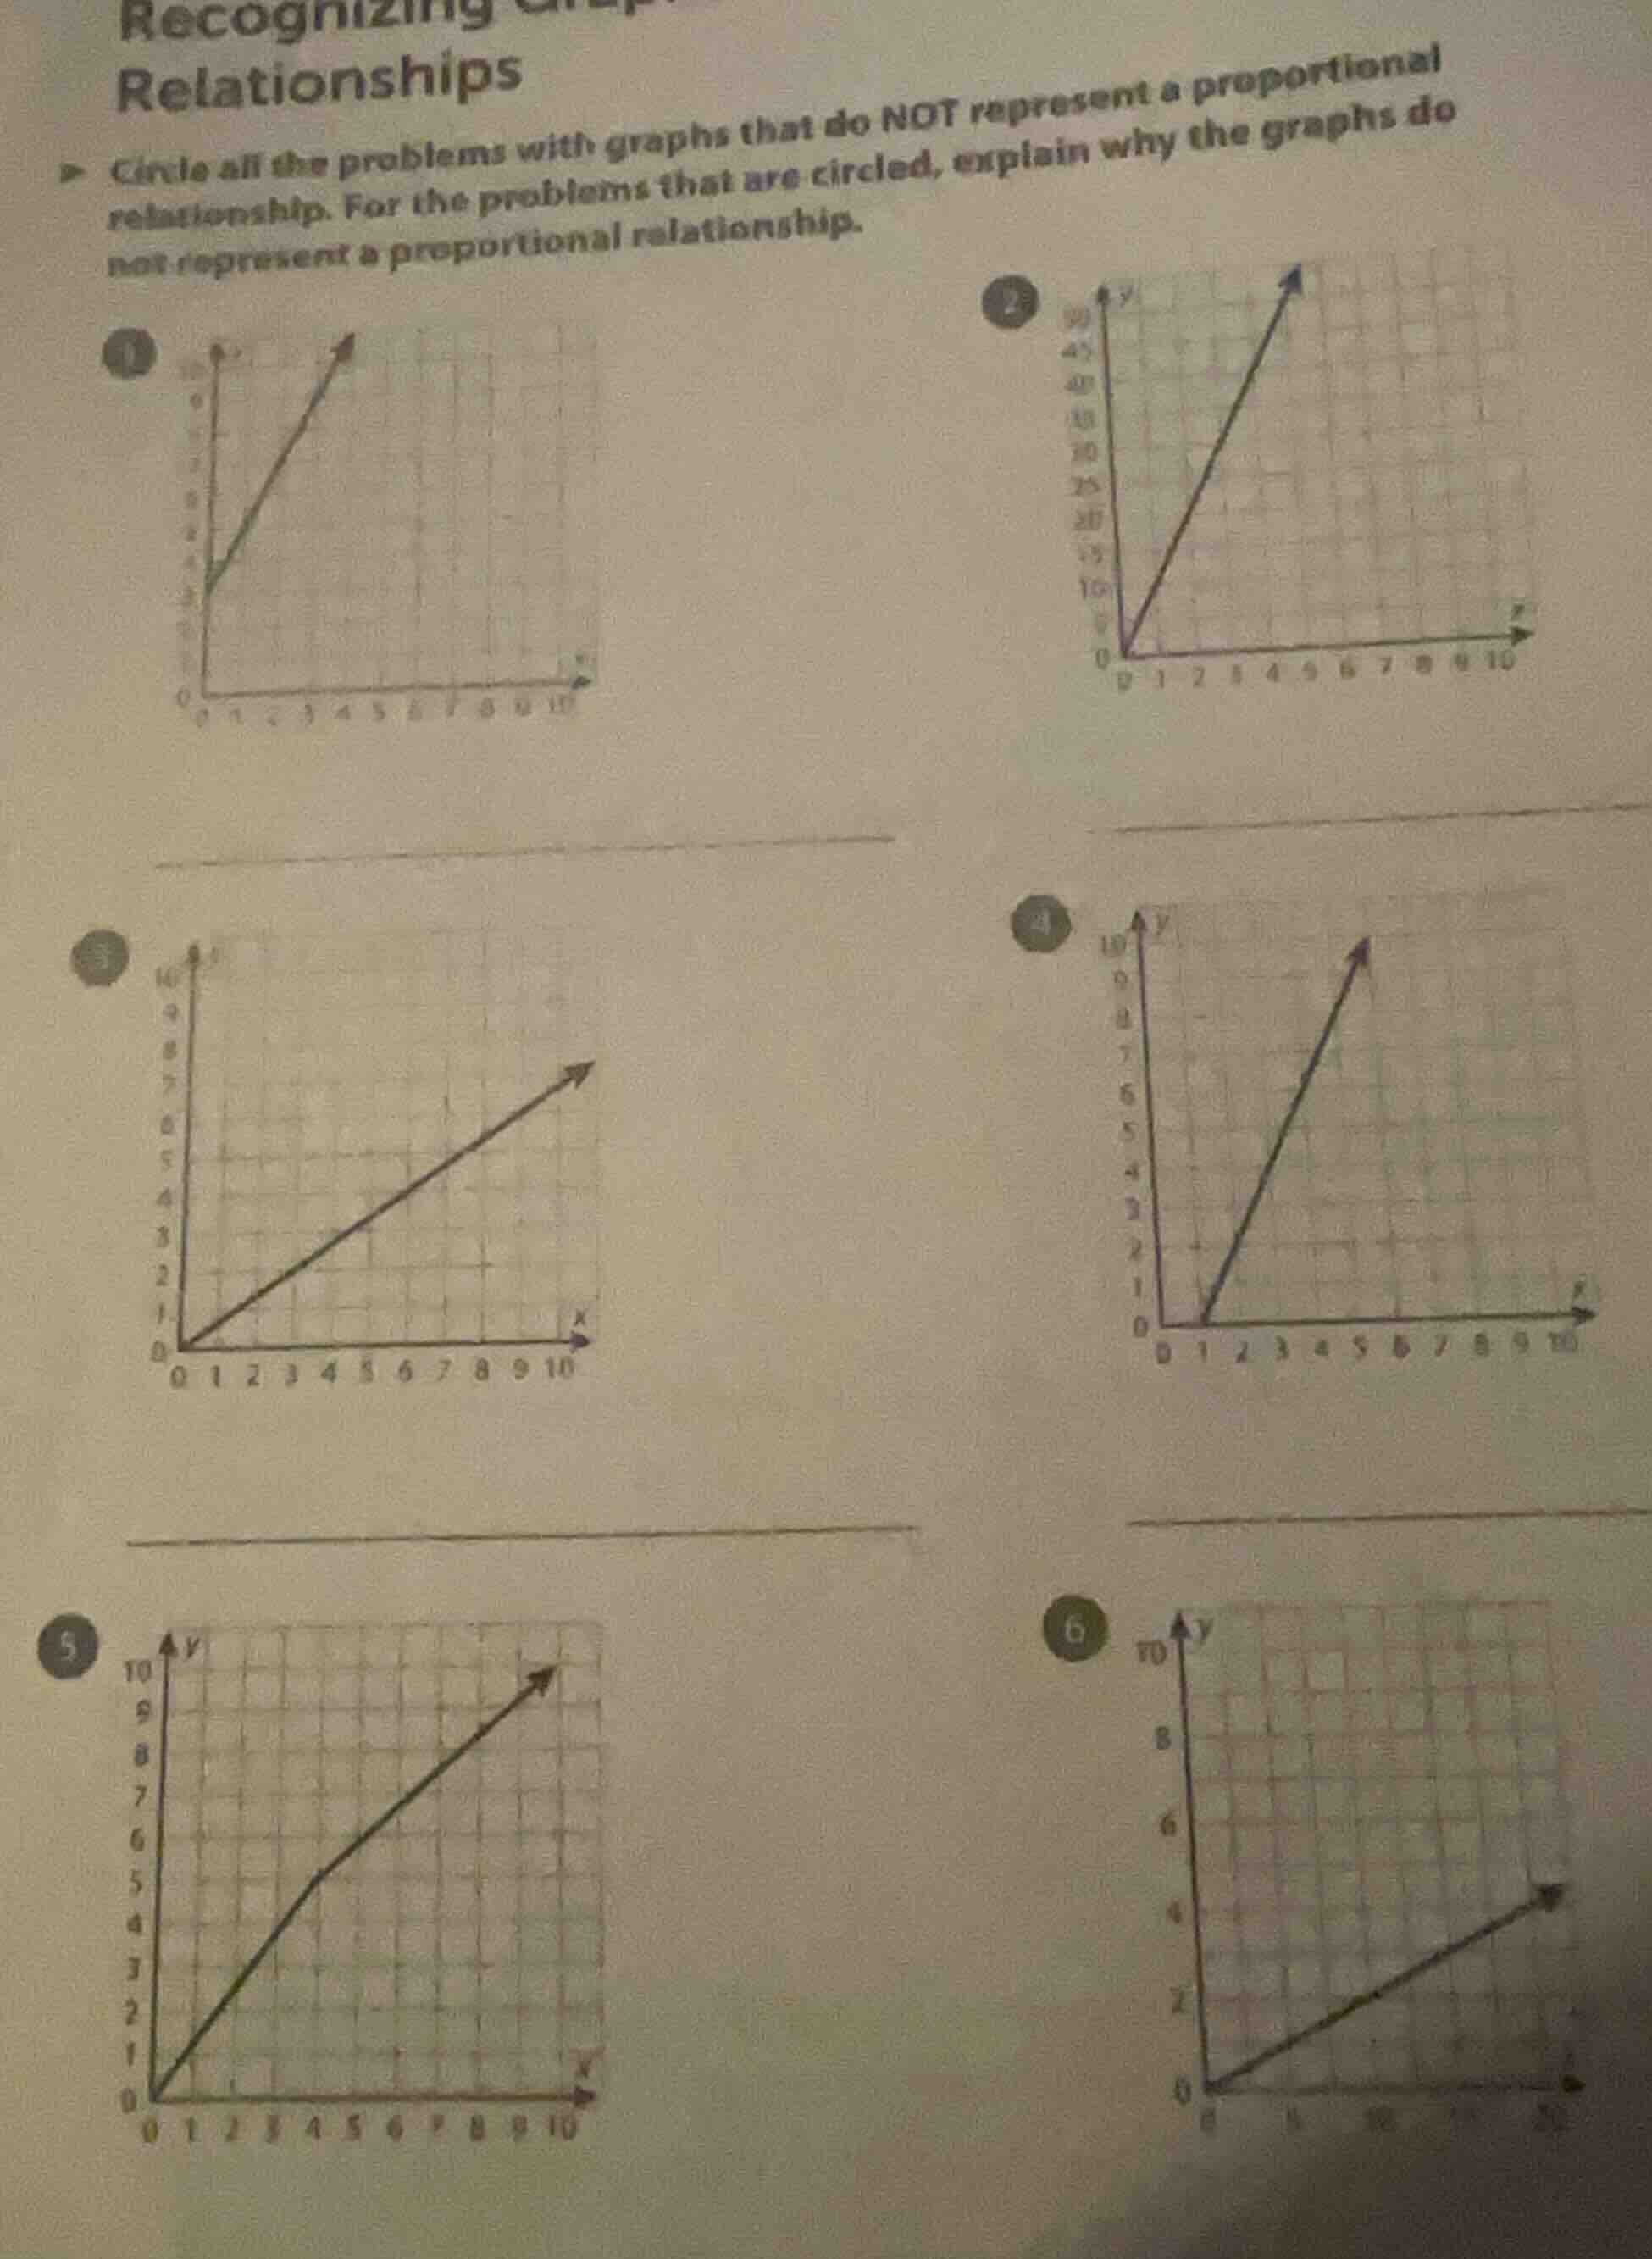
circle all the problems with graphs that do not represent a proportional relationship. for the problems that are circled, explain why the graphs do not represent a proportional relationship.
To determine if a graph represents a proportional relationship, we use the definition: a proportional relationship is a linear relationship (straight line) that passes through the origin \((0,0)\) and has a constant ratio \(\frac{y}{x}=k\) (constant of proportionality) for all non - zero \(x\).
Step 1: Analyze Graph 1
- The graph of problem 1 does not pass through the origin \((0,0)\). When \(x = 0\), \(y
eq0\). For a proportional relationship \(y=kx\), when \(x = 0\), \(y\) must be \(0\). So this graph does not represent a proportional relationship.
Step 2: Analyze Graph 2
- The graph of problem 2 passes through the origin \((0,0)\) and is a straight line. We can check the ratio \(\frac{y}{x}\). For example, if we take two points, say \((1,y_1)\) and \((2,y_2)\), the ratio \(\frac{y_1}{1}=\frac{y_2}{2}\) (since it's a straight line through the origin), so it represents a proportional relationship.
Step 3: Analyze Graph 3
- The graph of problem 3 passes through the origin \((0,0)\) and is a straight line. The ratio \(\frac{y}{x}\) will be constant for all \(x\) values (because it's a linear line through the origin), so it represents a proportional relationship.
Step 4: Analyze Graph 4
- The graph of problem 4 does not pass through the origin. When \(x = 0\), \(y = 0\)? No, when \(x=0\), \(y = 0\) but wait, looking at the graph, the line starts at \(x = 1\) (or some non - zero \(x\) for \(y = 0\)? Wait, no, the graph has a non - zero \(x\) intercept. Wait, actually, for a proportional relationship \(y=kx\), when \(x = 0\), \(y = 0\), but also the line should be such that for all \(x\), \(y\) is directly proportional. The graph of problem 4 does not pass through the origin? Wait, no, the graph starts at \(x = 1\) (the line starts when \(x=1\) with \(y = 0\)), so it does not pass through \((0,0)\) in the sense that the linear relationship does not include \((0,0)\) as a point on the line (the line is not defined at \(x = 0\) in the way a proportional relationship should be). So this graph does not represent a proportional relationship.
Step 5: Analyze Graph 5
- The graph of problem 5 is not a straight line. A proportional relationship is a linear relationship (\(y = kx\)) which is a straight line. Since this graph is a curve, it does not represent a proportional relationship.
Step 6: Analyze Graph 6
- The graph of problem 6 passes through the origin \((0,0)\) and is a straight line. The ratio \(\frac{y}{x}\) will be constant, so it represents a proportional relationship.
So the graphs that do not represent proportional relationships are 1, 4, and 5.

Snap & solve any problem in the app
Get step-by-step solutions on Sovi AI
Photo-based solutions with guided steps
Explore more problems and detailed explanations
The problems with graphs that do NOT represent a proportional relationship are 1, 4, and 5.
- Graph 1: Does not pass through the origin (\(x = 0,y
eq0\)), so \(y\) is not directly proportional to \(x\) (\(y
eq kx\) for all \(x\)).
- Graph 4: Does not pass through the origin (the line starts at a non - zero \(x\) for \(y = 0\)), so the relationship is not proportional (\(y\) is not \(kx\) for all \(x\)).
- Graph 5: Is a curved line, not a straight line. A proportional relationship is linear (\(y=kx\)), so it cannot be proportional.