QUESTION IMAGE
Question
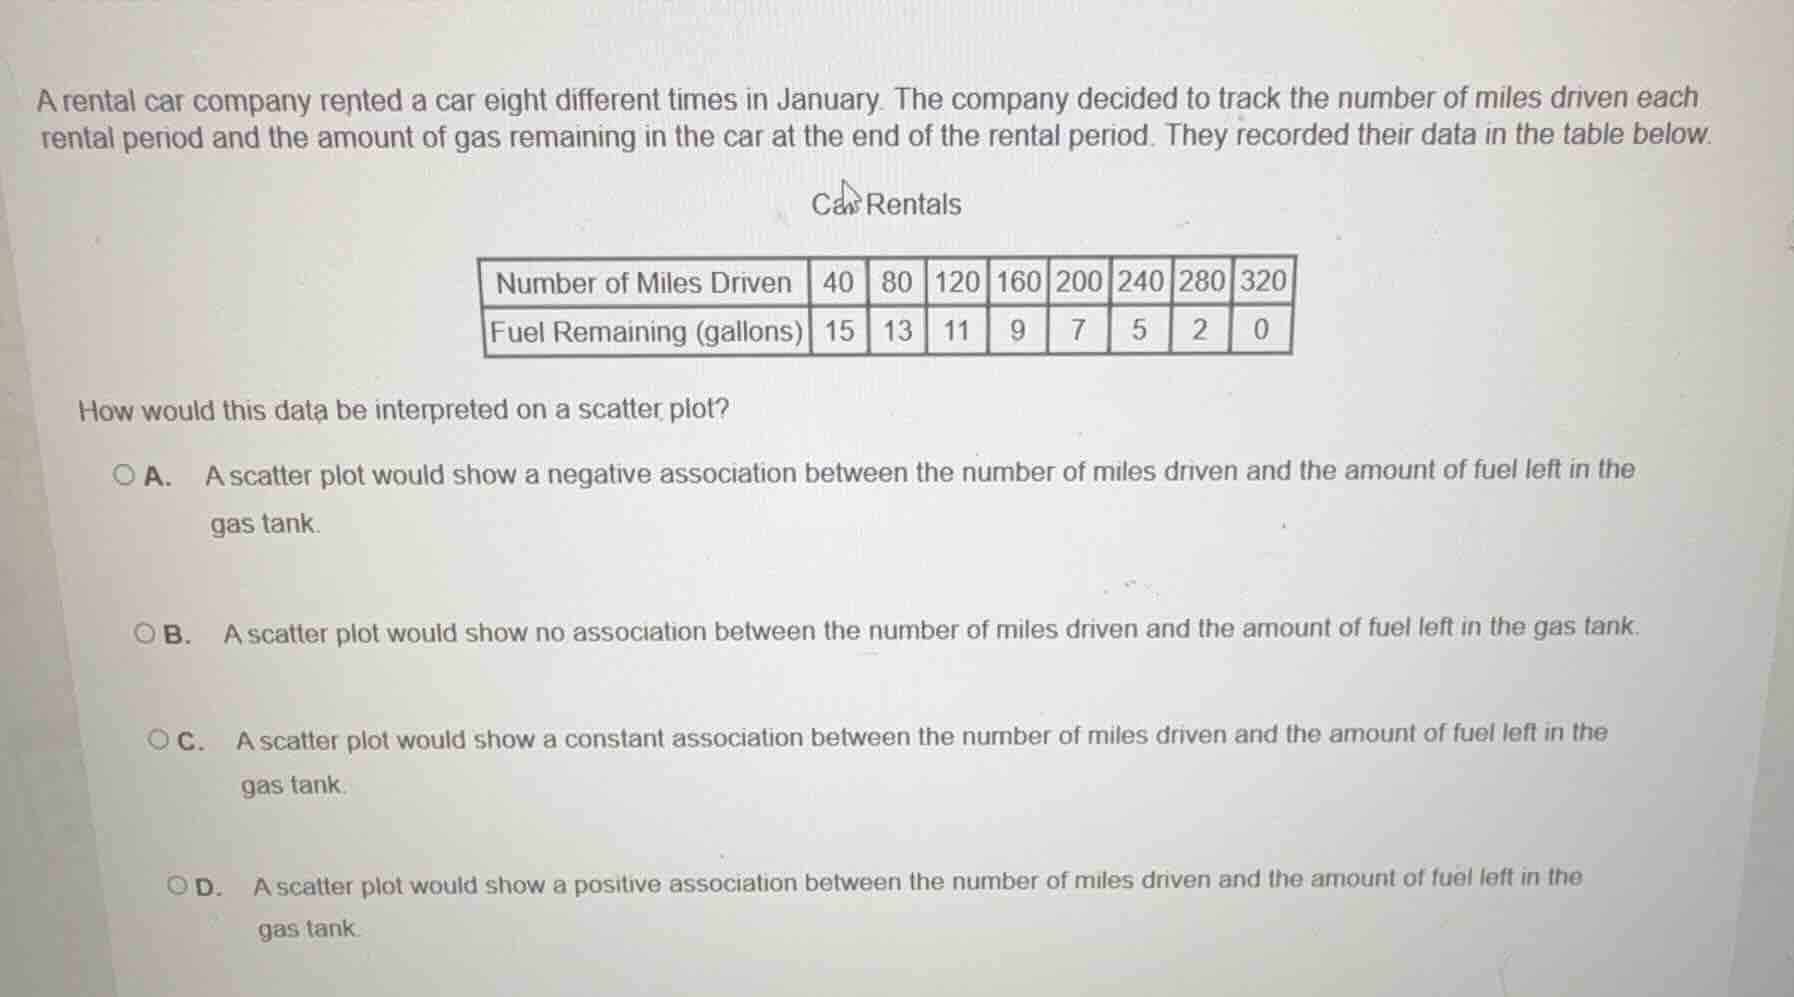
a rental car company rented a car eight different times in january. the company decided to track the number of miles driven each rental period and the amount of gas remaining in the car at the end of the rental period. they recorded their data in the table below.
car rentals
| number of miles driven | 40 | 80 | 120 | 160 | 200 | 240 | 280 | 320 |
| fuel remaining (gallons) | 15 | 13 | 11 | 9 | 7 | 5 | 2 | 0 |
how would this data be interpreted on a scatter plot?
a. a scatter plot would show a negative association between the number of miles driven and the amount of fuel left in the gas tank.
b. a scatter plot would show no association between the number of miles driven and the amount of fuel left in the gas tank.
c. a scatter plot would show a constant association between the number of miles driven and the amount of fuel left in the gas tank.
d. a scatter plot would show a positive association between the number of miles driven and the amount of fuel left in the gas tank.
As the number of miles driven increases, the fuel remaining in the tank consistently decreases. This inverse relationship is defined as a negative association in scatter plots.

Snap & solve any problem in the app
Get step-by-step solutions on Sovi AI
Photo-based solutions with guided steps
Explore more problems and detailed explanations
A. A scatter plot would show a negative association between the number of miles driven and the amount of fuel left in the gas tank.