QUESTION IMAGE
Question
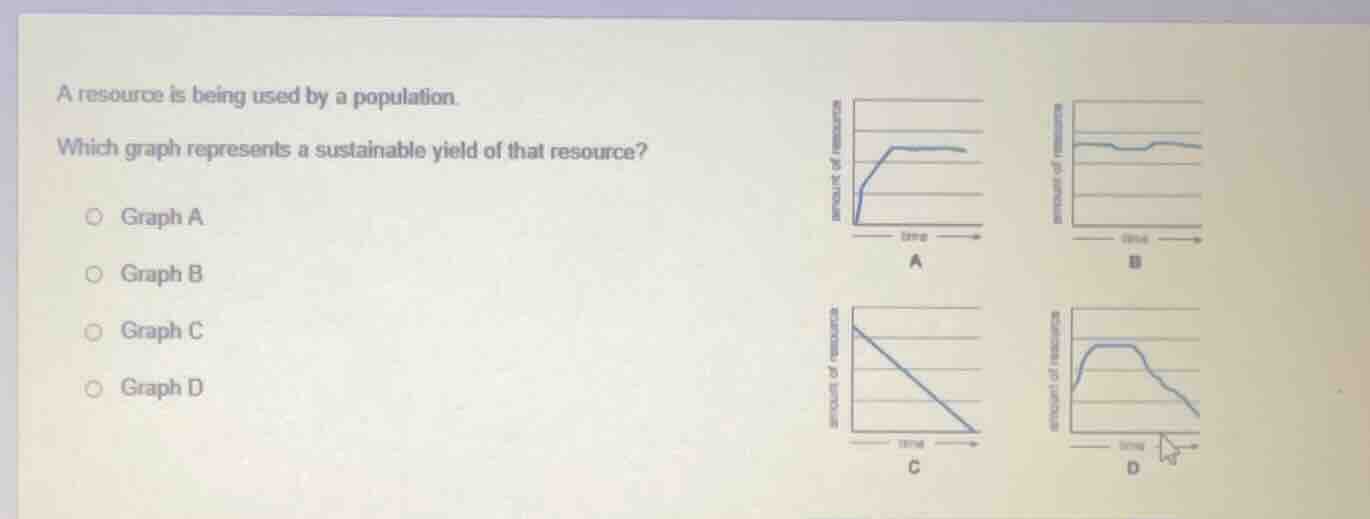
a resource is being used by a population. which graph represents a sustainable yield of that resource? graph a graph b graph c graph d
Brief Explanations
Sustainable resource yield means the resource level remains stable long-term, not declining or depleting. Graph A shows resource use rising to a steady, constant level (no depletion). Graph B stays stable but starts high, while Graphs C and D show resource decline/depletion, which is unsustainable.

Snap & solve any problem in the app
Get step-by-step solutions on Sovi AI
Photo-based solutions with guided steps
Explore more problems and detailed explanations
Graph A