QUESTION IMAGE
Question
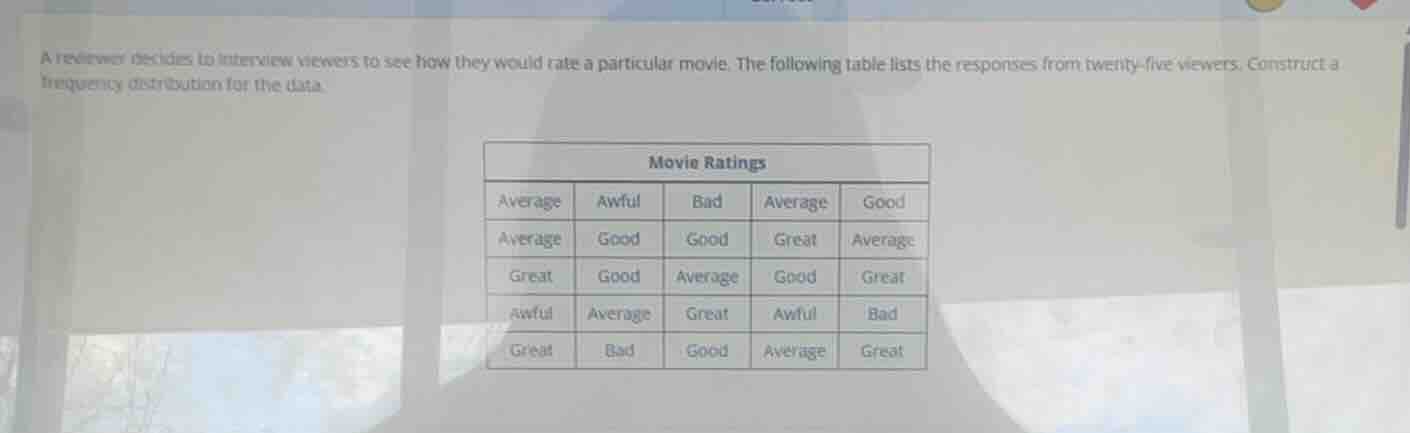
a reviewer decides to interview viewers to see how they would rate a particular movie. the following table lists the responses from twenty-five viewers. construct a frequency distribution for the data.
movie ratings
Step1: List all unique rating categories
Unique ratings: Awful, Bad, Average, Good, Great
Step2: Count frequency of each rating
- Count "Awful": $3$
- Count "Bad": $3$
- Count "Average": $7$
- Count "Good": $6$
- Count "Great": $6$
Verify total: $3+3+7+6+6=25$, matches total viewers.
Step3: Organize into frequency table
Structure the counts into a clear table.

Snap & solve any problem in the app
Get step-by-step solutions on Sovi AI
Photo-based solutions with guided steps
Explore more problems and detailed explanations
| Movie Rating | Frequency |
|---|---|
| Bad | 3 |
| Average | 7 |
| Good | 6 |
| Great | 6 |