QUESTION IMAGE
Question
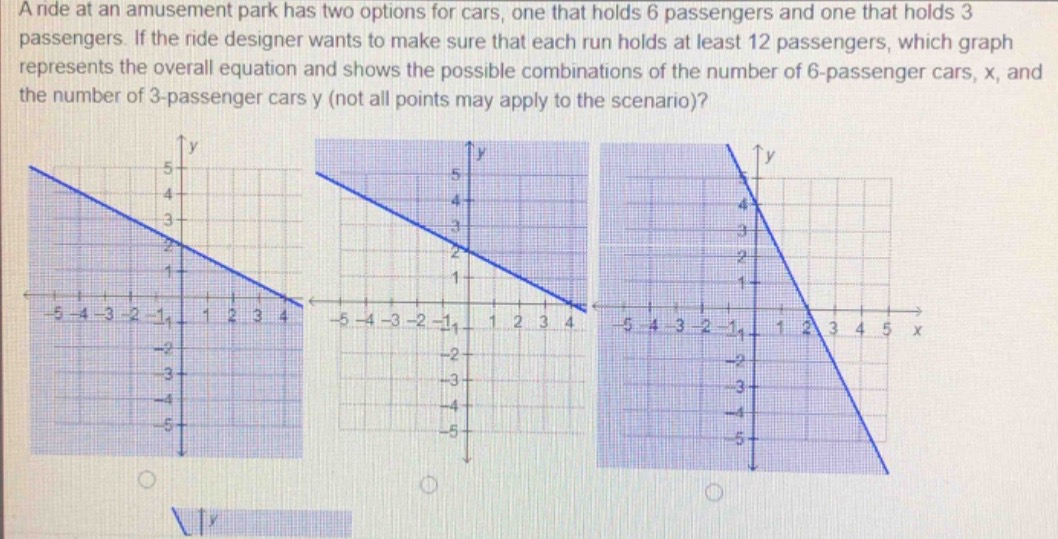
a ride at an amusement park has two options for cars, one that holds 6 passengers and one that holds 3 passengers. if the ride designer wants to make sure that each run holds at least 12 passengers, which graph represents the overall equation and shows the possible combinations of the number of 6 - passenger cars, x, and the number of 3 - passenger cars y (not all points may apply to the scenario)?
Step1: Define the inequality
Each 6-passenger car contributes $6x$ passengers, each 3-passenger car contributes $3y$ passengers, and total passengers are at least 12.
$$6x + 3y \geq 12$$
Step2: Simplify the inequality
Divide all terms by 3 to simplify.
$$2x + y \geq 4$$
Rearrange to slope-intercept form:
$$y \geq -2x + 4$$
Step3: Analyze the graph properties
- The boundary line is $y = -2x + 4$, which has a y-intercept of 4 and x-intercept of 2 (set $y=0$: $0=-2x+4 \implies x=2$).
- The inequality $\geq$ means the region above and including the boundary line is shaded.

Snap & solve any problem in the app
Get step-by-step solutions on Sovi AI
Photo-based solutions with guided steps
Explore more problems and detailed explanations
The third graph (with boundary line crossing y-axis at 4, x-axis at 2, and the area above the line shaded) is the correct one.