QUESTION IMAGE
Question
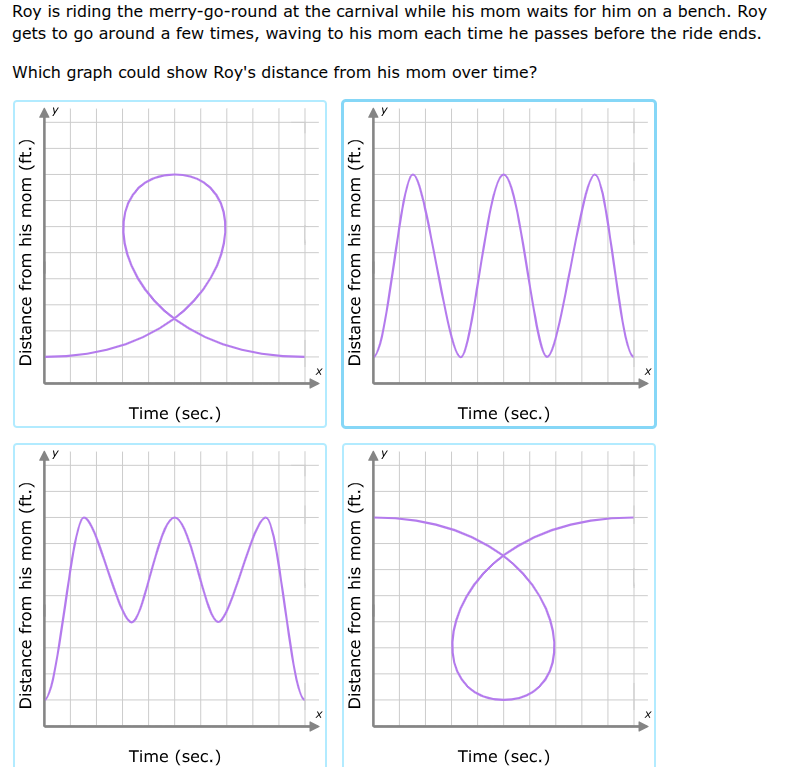
roy is riding the merry - go - round at the carnival while his mom waits for him on a bench. roy gets to go around a few times, waving to his mom each time he passes before the ride ends. which graph could show roys distance from his mom over time?
Step1: Analyze the motion
Roy is on a merry - go - round, which is a circular motion. The distance from his mom (who is stationary on a bench) will vary in a periodic way. When he is closest to his mom, the distance is minimum, and when he is farthest (diametrically opposite), the distance is maximum. And this pattern repeats as the merry - go - round rotates.
Step2: Analyze the graphs
- The first and fourth graphs have non - periodic or non - physical (like loops which would imply going back in time) behavior. In the context of time (x - axis) moving forward, we can't have a graph with loops as it would mean at a later time, the object is at a position it was at an earlier time in a non - periodic (and non - physical for this motion) way.
- The third graph: The distance starts from a non - zero value and goes to a minimum, but the key is the shape of the peaks and troughs. However, the second graph shows a periodic pattern where the distance increases to a maximum, decreases to a minimum, and repeats. This is consistent with the circular motion of the merry - go - round, where the distance from the mom (a fixed point) will have a periodic variation with a maximum (when Roy is farthest from the mom's position on the circle) and a minimum (when he is closest) and this cycle repeats as the merry - go - round rotates.

Snap & solve any problem in the app
Get step-by-step solutions on Sovi AI
Photo-based solutions with guided steps
Explore more problems and detailed explanations
The graph in the second (top - right) box, which shows a periodic pattern of distance increasing to a peak, decreasing to a trough, and repeating as time increases.