QUESTION IMAGE
Question
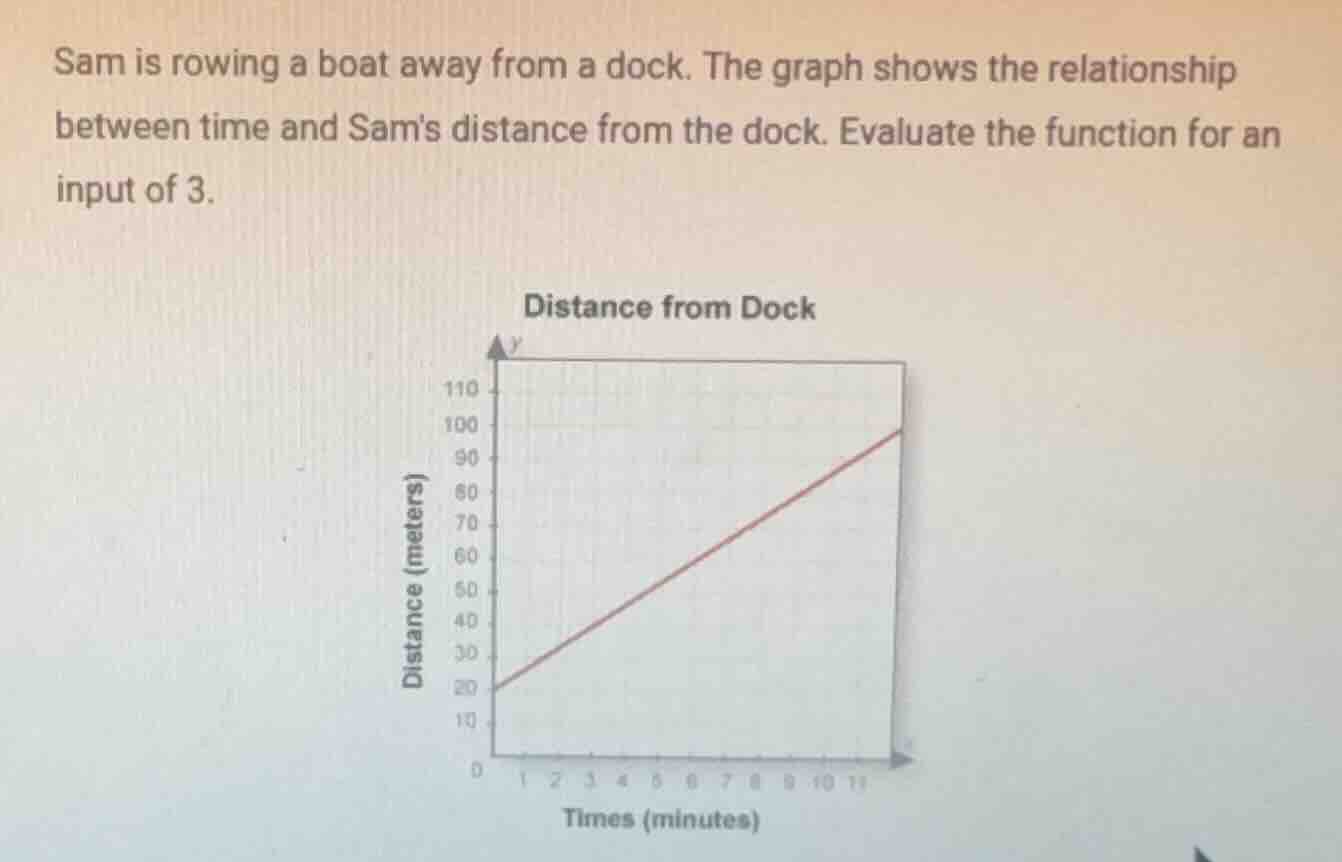
sam is rowing a boat away from a dock. the graph shows the relationship between time and sams distance from the dock. evaluate the function for an input of 3.
Step1: Determine the function type
The graph is a straight line, so it represents a linear function. Let's assume the linear function is \( y = mx + b \), where \( x \) is time (minutes) and \( y \) is distance (meters). From the graph, when \( x = 0 \), \( y = 20 \), so \( b = 20 \).
Step2: Find the slope \( m \)
We can also see that when \( x = 11 \), \( y = 100 \) (approximate from the graph). Using the slope formula \( m=\frac{y_2 - y_1}{x_2 - x_1} \), with \( (x_1,y_1)=(0,20) \) and \( (x_2,y_2)=(11,100) \), we get \( m=\frac{100 - 20}{11 - 0}=\frac{80}{11}\approx7.27 \). But maybe a better way is to look at the rate. Alternatively, since at \( x = 0 \), \( y = 20 \), and let's check the pattern. Wait, maybe the graph has a y - intercept of 20 and let's see the change. Wait, another approach: when \( x = 3 \), we can find the y - value from the graph. Wait, the graph is a straight line. Let's see, the y - axis is distance (meters), x - axis is time (minutes). The line starts at (0,20) and goes to (11,100). The equation of the line: \( y=mx + 20 \). Let's take two points: (0,20) and (11,100). The slope \( m=\frac{100 - 20}{11-0}=\frac{80}{11}\approx7.27 \). But maybe we can use the fact that for a linear function, the rate is constant. Alternatively, maybe the graph is such that when \( x = 3 \), we can calculate the y - value. Wait, let's think again. The input is 3 (time in minutes), so we need to find the distance (output) when \( x = 3 \). Let's find the equation of the line. The y - intercept \( b = 20 \) (when \( x = 0 \), \( y = 20 \)). Let's take another point, say when \( x = 11 \), \( y = 100 \). So the slope \( m=\frac{100 - 20}{11}=\frac{80}{11}\approx7.27 \). Then the equation is \( y=\frac{80}{11}x + 20 \). Now, substitute \( x = 3 \): \( y=\frac{80}{11}\times3+20=\frac{240}{11}+20=\frac{240 + 220}{11}=\frac{460}{11}\approx41.82 \). Wait, but maybe the graph is drawn with a slope of 8? Wait, no, maybe I misread the graph. Wait, the y - axis: 20, 30, 40, 50, 60, 70, 80, 90, 100. The x - axis: 0,1,2,3,4,5,6,7,8,9,10,11. Wait, maybe the line passes through (0,20) and (10,90)? Wait, no, the end point is at (11,100) maybe. Wait, alternatively, maybe the slope is 8? Wait, no, let's check the difference. From x = 0 (y = 20) to x = 11 (y = 100), the change in y is 80, change in x is 11, so slope is 80/11. But maybe the problem is simpler. Wait, maybe the graph is such that when x = 3, we can look at the graph. Wait, the line starts at (0,20), and for each minute, how much does it increase? Let's see, from x = 0 to x = 11, y goes from 20 to 100, so over 11 minutes, it increases by 80 meters, so per minute, it's 80/11 ≈7.27 meters per minute. So at x = 3, y = 20+3(80/11)=20 + 240/11=(220 + 240)/11=460/11≈41.82. But maybe the graph is intended to have a slope of 8? Wait, no, maybe I made a mistake. Wait, let's check the graph again. The y - axis: 20, 30, 40, 50, 60, 70, 80, 90, 100. The x - axis: 0,1,2,3,4,5,6,7,8,9,10,11. The line goes from (0,20) to (11,100). So the equation is \( y=\frac{80}{11}x + 20 \). Now, plug x = 3: \( y=\frac{80}{11}\times3+20=\frac{240}{11}+20=\frac{240 + 220}{11}=\frac{460}{11}\approx41.82 \). But maybe the graph is drawn with a slope of 8, let's check: if m = 8, then y = 8x + 20. When x = 11, y = 811+20=88 + 20=108, which is more than 100. So that's not right. Wait, maybe the end point is (10,90)? Then slope would be (90 - 20)/10=7. Then y = 7x + 20. When x = 3, y = 7*3+20=21 + 20=41. That's close to our previous calculation. Maybe the graph is approximated. So using y = 7x + 20, when x =…

Snap & solve any problem in the app
Get step-by-step solutions on Sovi AI
Photo-based solutions with guided steps
Explore more problems and detailed explanations
\( \approx42 \) (or more precisely \( \frac{460}{11}\approx41.82 \))