QUESTION IMAGE
Question
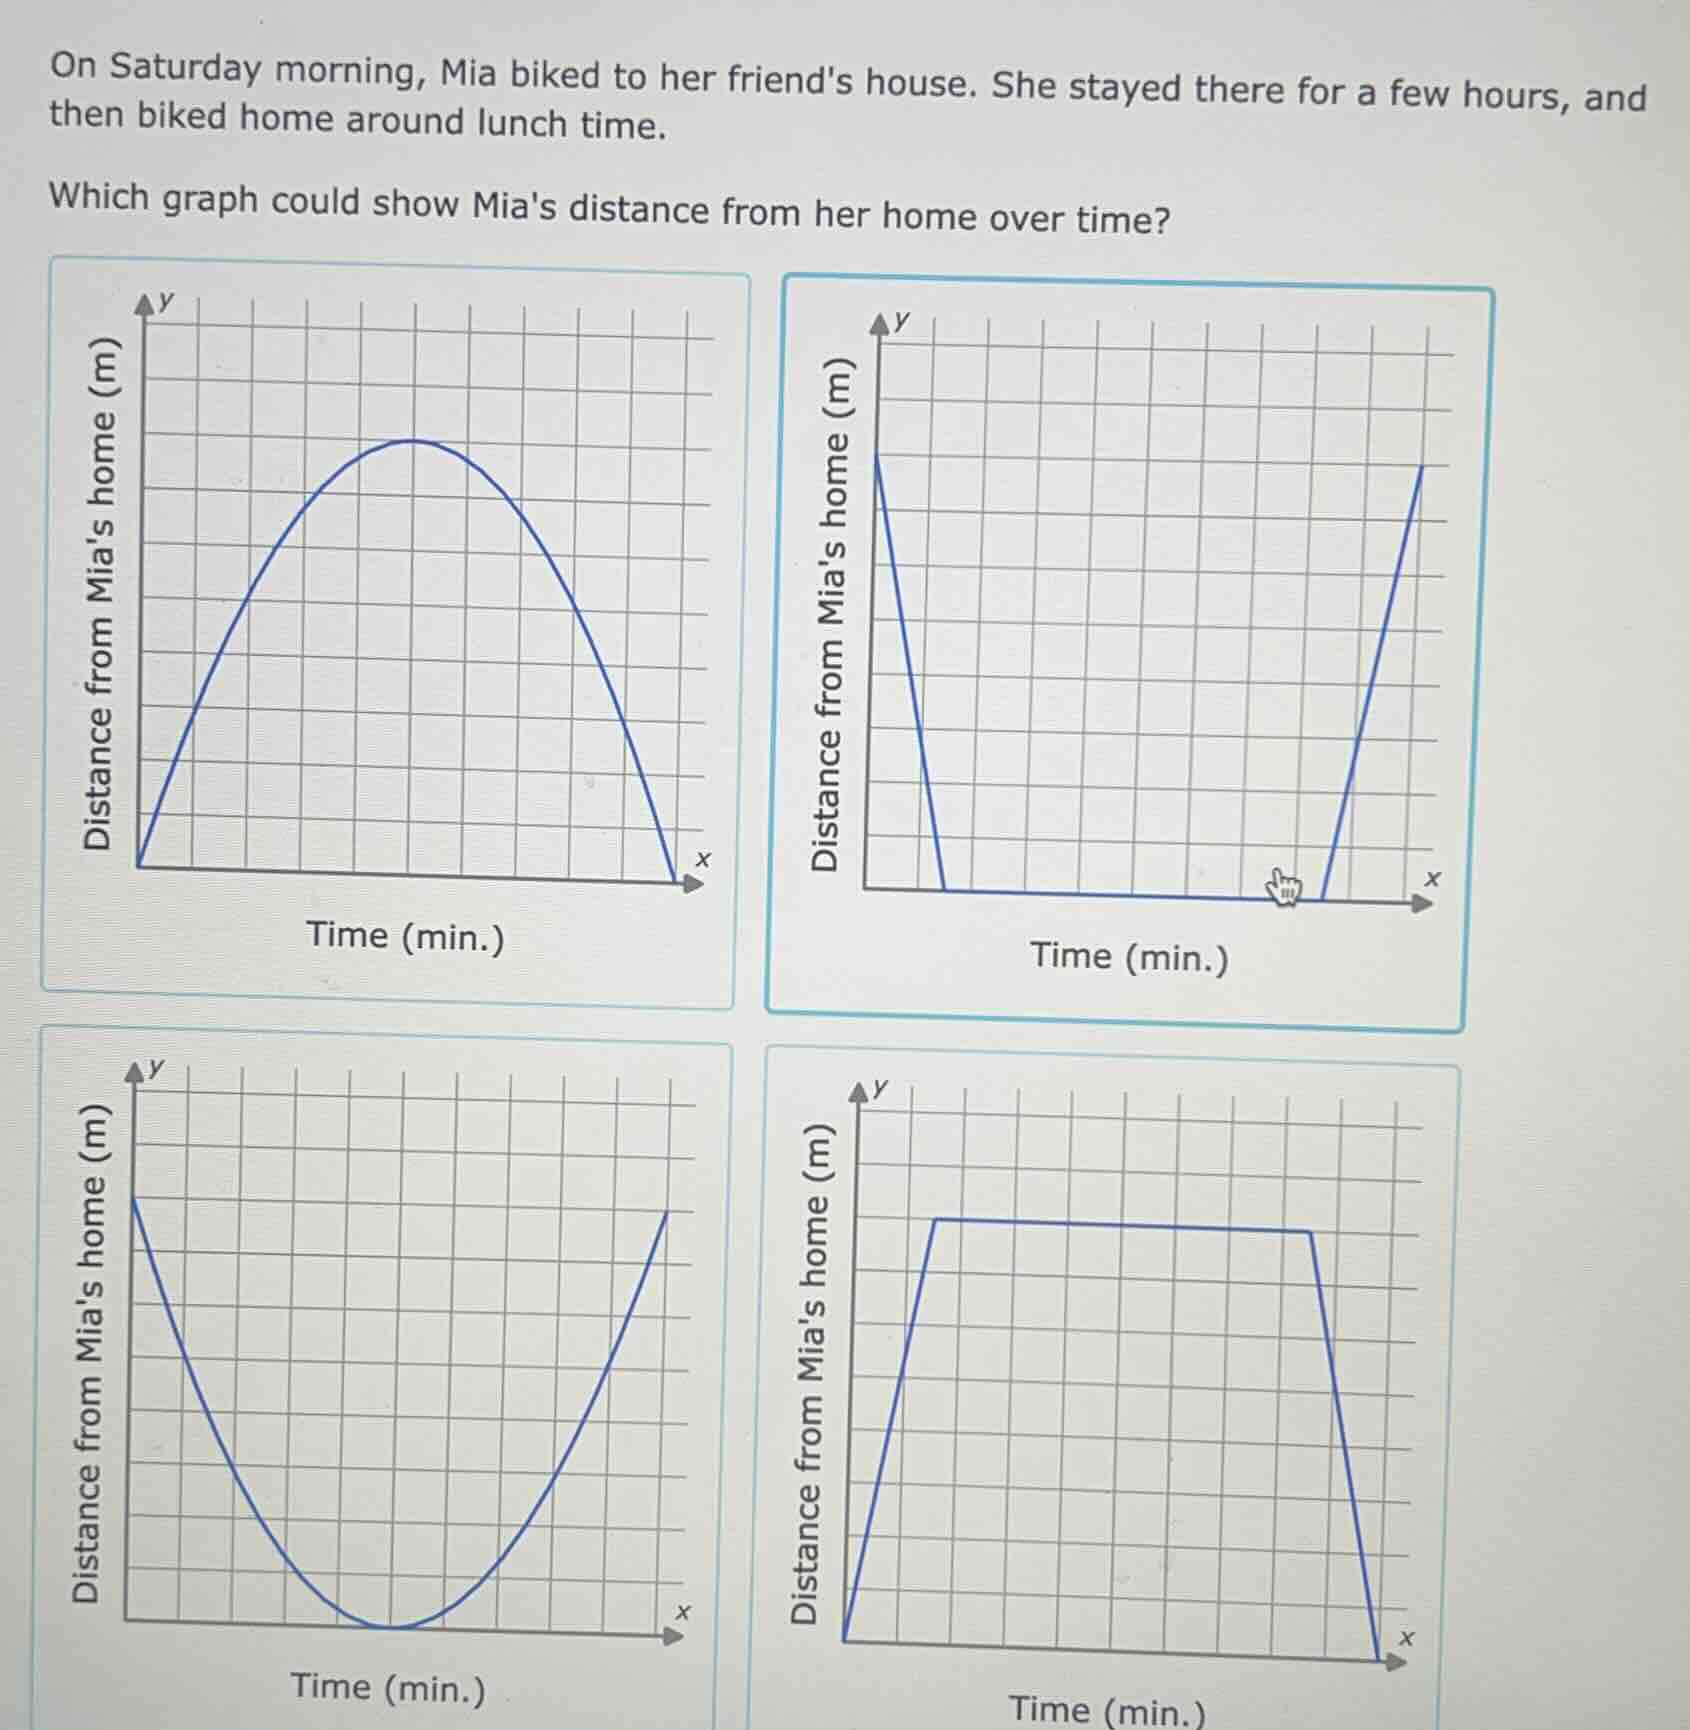
on saturday morning, mia biked to her friends house. she stayed there for a few hours, and then biked home around lunch time. which graph could show mias distance from her home over time? four graphs are shown, each with distance from mias home (m) on the y - axis and time (min.) on the x - axis. the first graph is a curve that rises then falls. the second graph has a steep drop, then a flat line, then a steep rise. the third graph is a u - shaped curve. the fourth graph rises, then is flat, then drops to zero.
Step1: Analyze Mia's journey phases
Mia starts at home, so initial distance is 0. She bikes to friend's house: distance increases over time (linear or near - linear, as speed is constant for biking). Then she stays: distance remains constant (horizontal line) for a few hours. Then she bikes home: distance decreases back to 0.
Step2: Evaluate each graph
- First graph: Curved, not matching constant speed phases (biking should be linear segments, stay is horizontal).
- Second graph: Starts at non - zero distance, wrong (she starts at home, distance 0).
- Third graph: Starts at non - zero distance, wrong.
- Fourth graph: Starts at 0, increases (biking to friend), horizontal (staying), then decreases to 0 (biking home). Matches the journey.

Snap & solve any problem in the app
Get step-by-step solutions on Sovi AI
Photo-based solutions with guided steps
Explore more problems and detailed explanations
The fourth graph (the one with a rising segment, a horizontal segment, and then a falling segment, starting and ending at distance 0 from home)