QUESTION IMAGE
Question
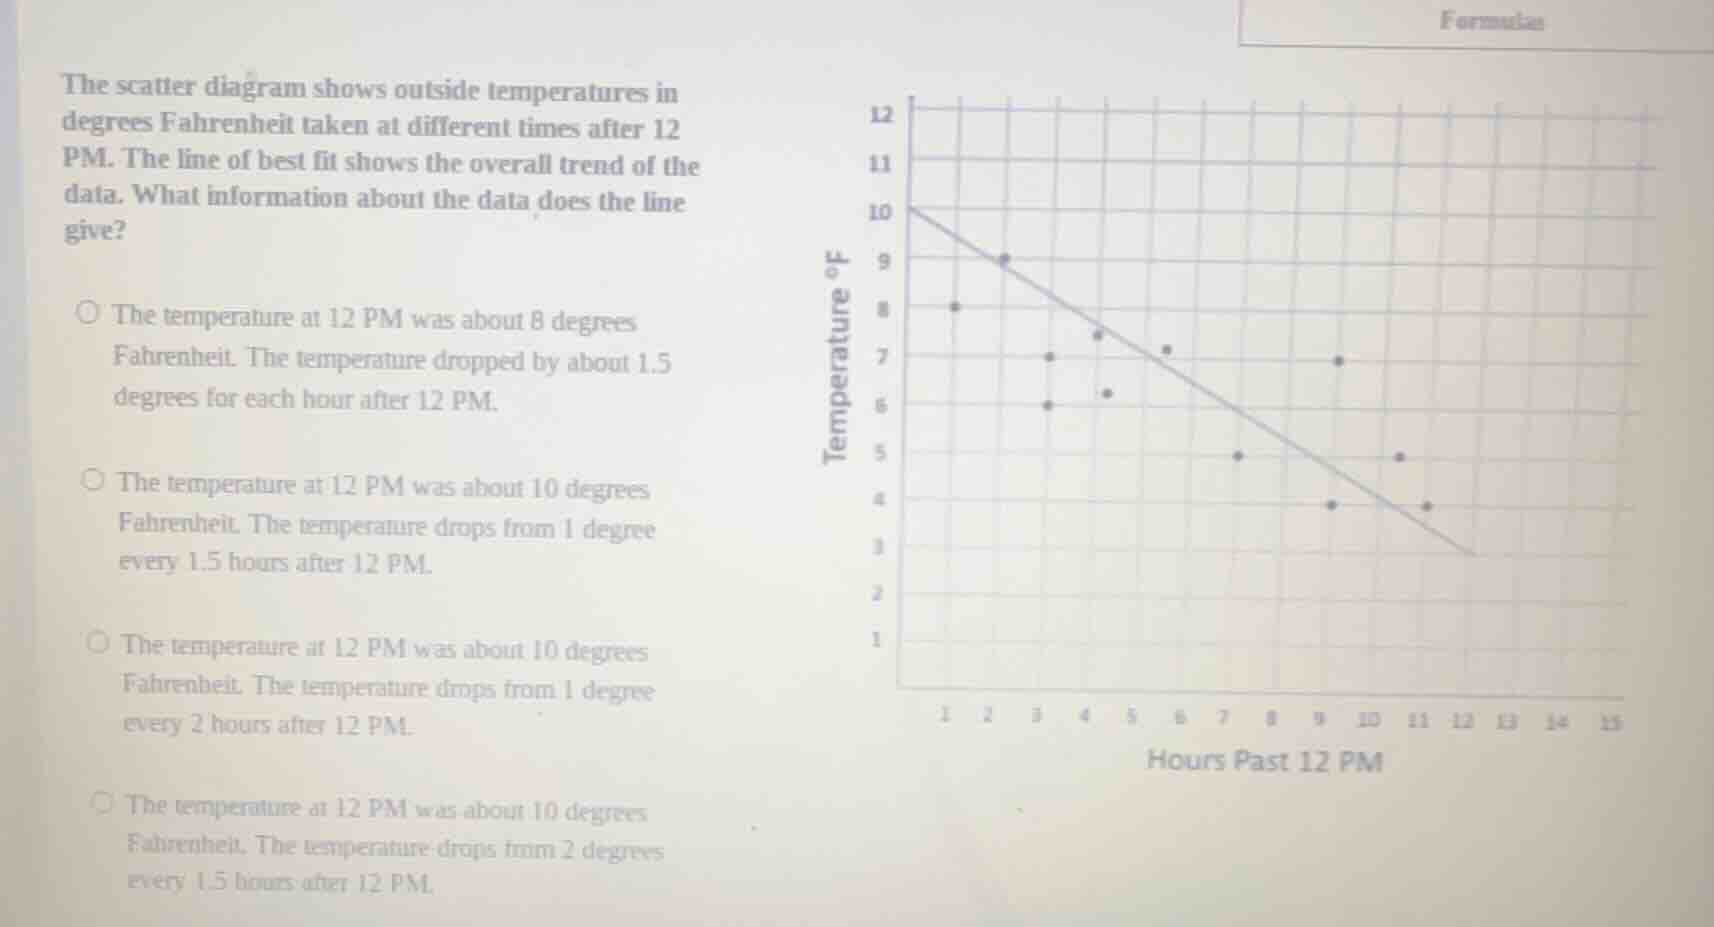
the scatter diagram shows outside temperatures in degrees fahrenheit taken at different times after 12 pm. the line of best fit shows the overall trend of the data. what information about the data does the line give?
the temperature at 12 pm was about 8 degrees fahrenheit. the temperature dropped by about 1.5 degrees for each hour after 12 pm.
the temperature at 12 pm was about 10 degrees fahrenheit. the temperature drops from 1 degree every 1.5 hours after 12 pm.
the temperature at 12 pm was about 10 degrees fahrenheit. the temperature drops from 1 degree every 2 hours after 12 pm.
the temperature at 12 pm was about 10 degrees fahrenheit. the temperature drops from 2 degrees every 1.5 hours after 12 pm.
- First, analyze the y - intercept of the line of best fit: The line of best fit intersects the y - axis (when hours past 12 PM = 0, i.e., at 12 PM) at \(y = 10\). So the temperature at 12 PM is about 10 degrees Fahrenheit. This eliminates the first option which says the temperature at 12 PM was about 8 degrees.
- Then, calculate the slope of the line of best fit. Let's take two points on the line. We know the line passes through \((0,10)\) (at 12 PM, 0 hours past 12, temperature 10°F) and let's take another point, for example, when \(x = 3\) hours, from the line, the temperature seems to be around 7°F (by looking at the trend). The slope \(m=\frac{y_2 - y_1}{x_2 - x_1}=\frac{7 - 10}{3 - 0}=\frac{- 3}{3}=- 1\) per 3 hours? Wait, no, let's take more accurate points. Let's take \((0,10)\) and \((1.5,9)\) (approximate from the line). The slope \(m=\frac{9 - 10}{1.5-0}=\frac{- 1}{1.5}=-\frac{2}{3}\approx - 0.666\) degrees per hour? Wait, no, let's check the rate of temperature drop. The line goes from (0,10) to (12, 2) (approximate end - point). The change in y (temperature) is \(2 - 10=-8\) over a change in x (hours) of \(12-0 = 12\) hours. So the rate of change is \(\frac{-8}{12}=-\frac{2}{3}\approx - 0.666\) degrees per hour. But let's check the options. The second option says "drops by 1 degree every 1.5 hours". Let's see: if the temperature drops 1 degree every 1.5 hours, the slope (rate of change) is \(\frac{- 1}{1.5}=-\frac{2}{3}\) degrees per hour, which matches our calculation. Let's verify with the options:
- Option 2: "The temperature at 12 PM was about 10 degrees Fahrenheit. The temperature drops by 1 degree every 1.5 hours after 12 PM." The y - intercept is 10 (correct for 12 PM temperature). The rate of change: if in 1.5 hours, the temperature drops 1 degree, then the slope is \(\frac{-1}{1.5}=-\frac{2}{3}\) degrees per hour, which is consistent with the line of best fit.
- Option 3: Says drops 1 degree every 2 hours. The slope would be \(\frac{-1}{2}=-0.5\) degrees per hour, which does not match our calculation.
- Option 4: Says drops 2 degrees every 1.5 hours. The slope would be \(\frac{-2}{1.5}=-\frac{4}{3}\approx - 1.333\) degrees per hour, which does not match.

Snap & solve any problem in the app
Get step-by-step solutions on Sovi AI
Photo-based solutions with guided steps
Explore more problems and detailed explanations
The temperature at 12 PM was about 10 degrees Fahrenheit. The temperature drops by about 1 degree for each 1.5 hours after 12 PM. (The option corresponding to this description, assuming the options are labeled as follows: Let's assume the second option is the one with this description. If the options are labeled as A, B, C, D, and the second option is, say, B, then the answer is B. But from the given options in the problem, the second option (the one starting with "The temperature at 12 PM was about 10 degrees Fahrenheit. The temperature drops from 1 degree every 1.5 hours after 12 PM.") is the correct one.)