QUESTION IMAGE
Question
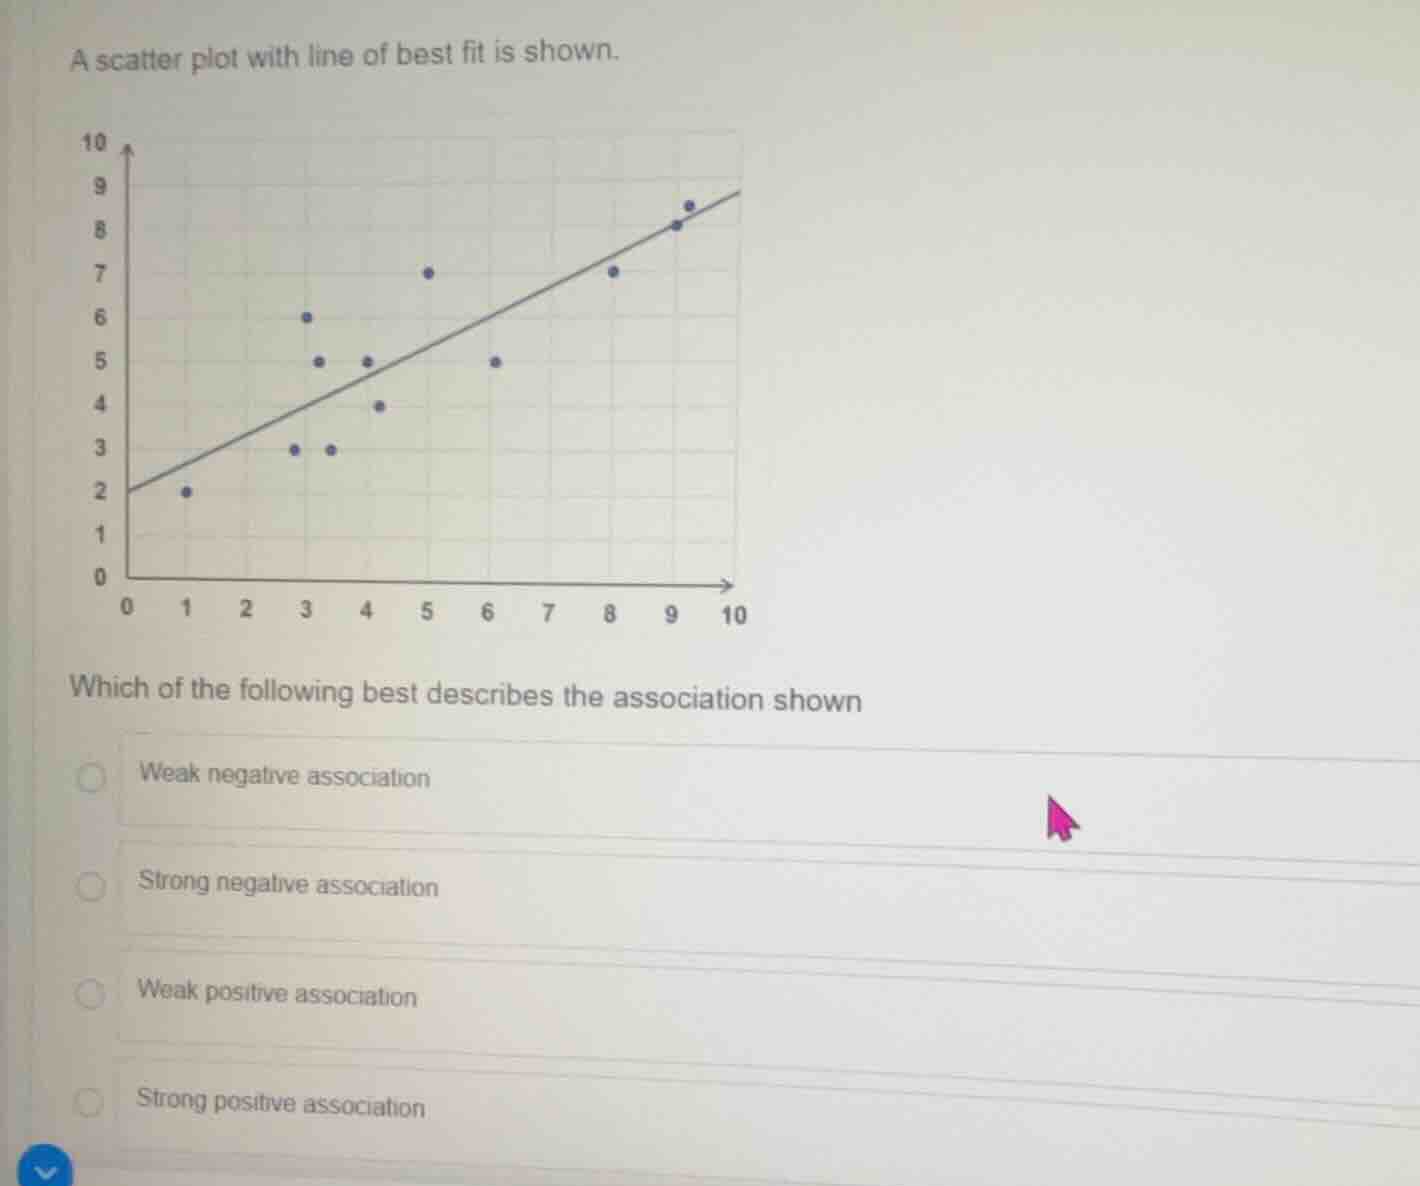
a scatter plot with line of best fit is shown.
which of the following best describes the association shown
weak negative association
strong negative association
weak positive association
strong positive association
Brief Explanations
- Direction of Association: As the x-values increase, the y-values generally increase, so this is a positive association.
- Strength of Association: The data points are relatively close to the upward-sloping line of best fit, but there is some noticeable scatter around the line, indicating a weak to moderate, not strong, positive relationship.

Snap & solve any problem in the app
Get step-by-step solutions on Sovi AI
Photo-based solutions with guided steps
Explore more problems and detailed explanations
Weak positive association