QUESTION IMAGE
Question
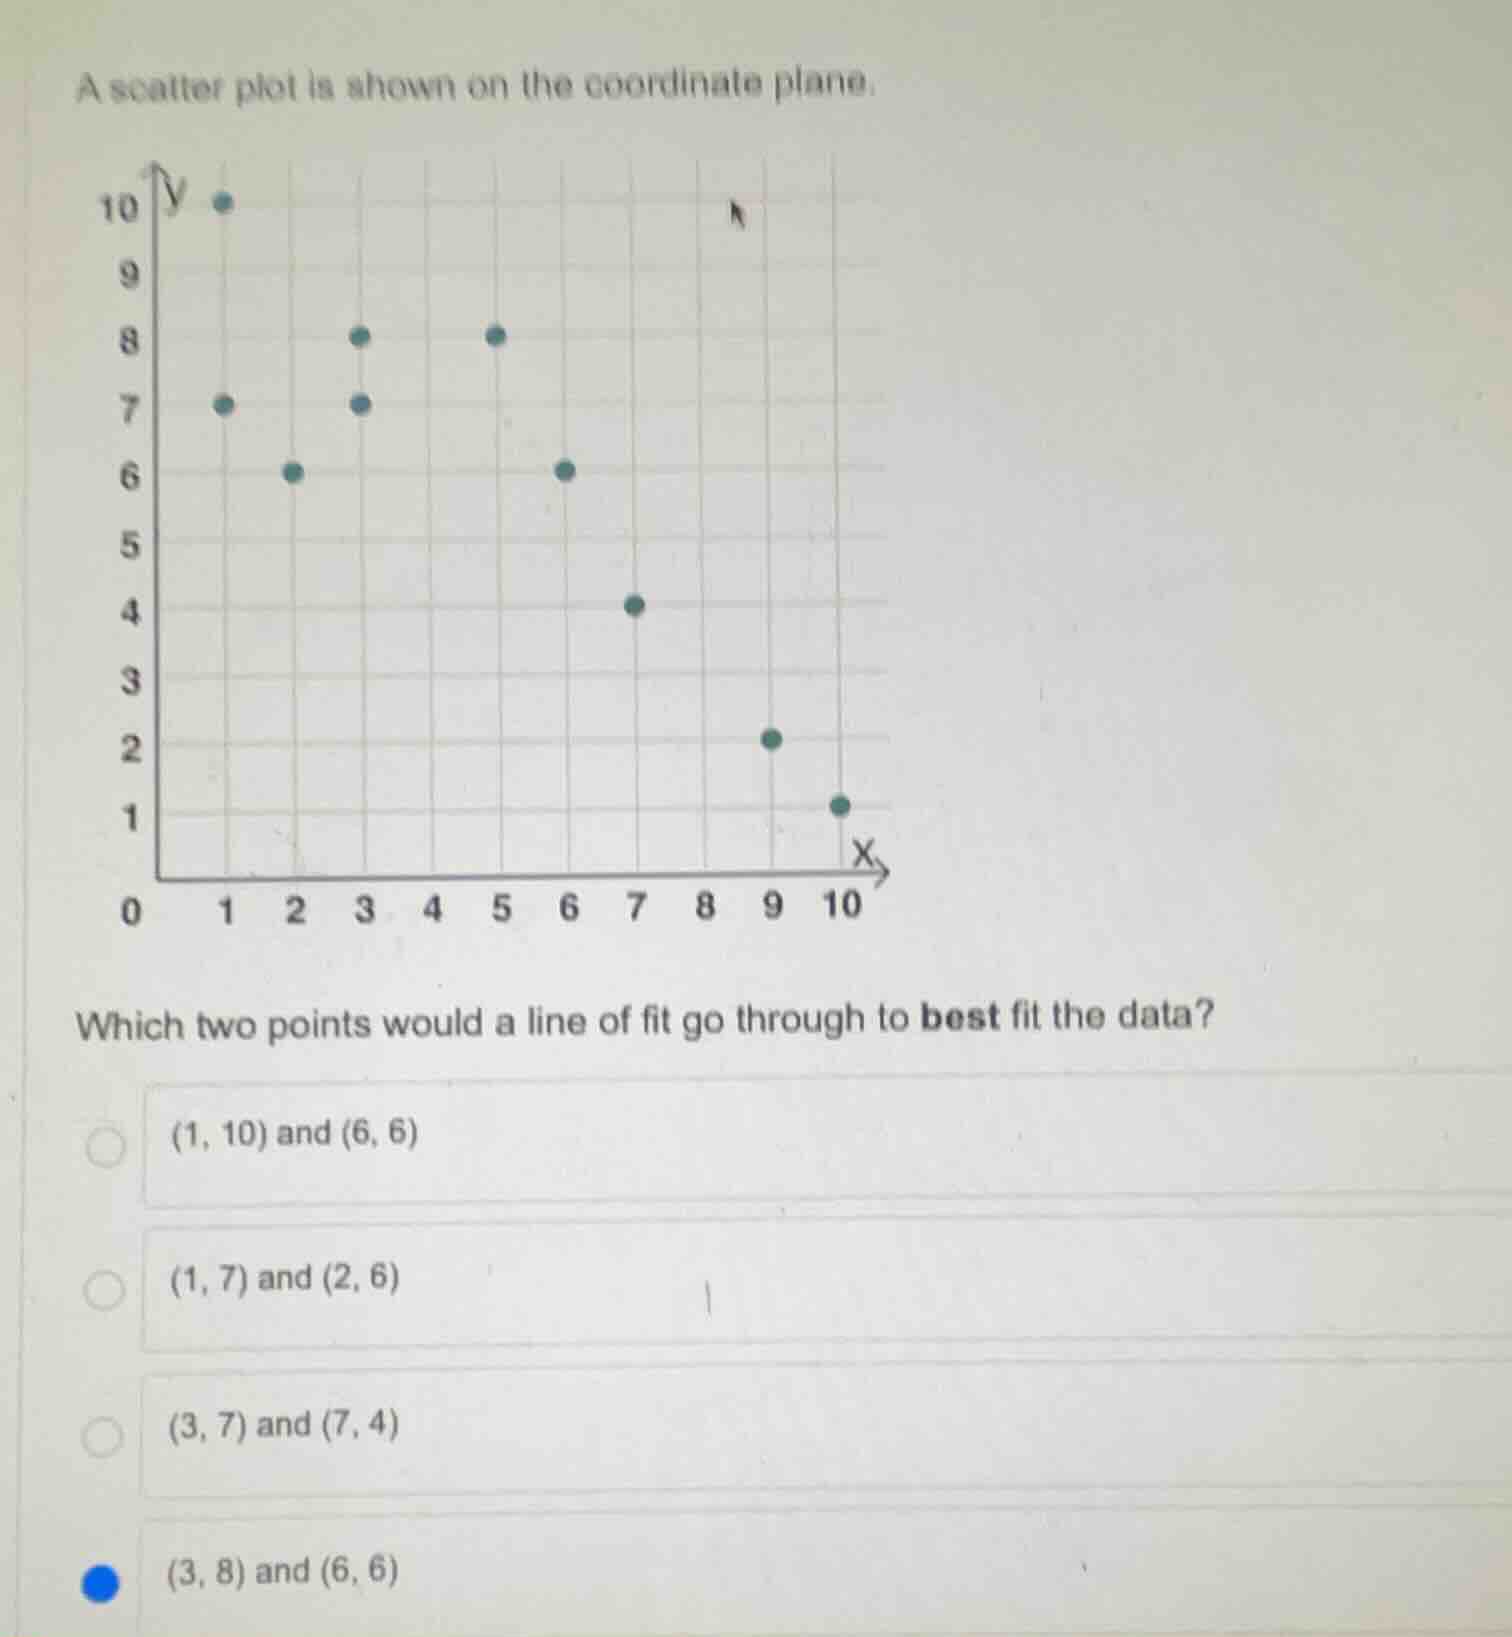
a scatter plot is shown on the coordinate plane.which two points would a line of fit go through to best fit the data?(1, 10) and (6, 6)(1, 7) and (2, 6)(3, 7) and (7, 4)(3, 8) and (6, 6)
Brief Explanations
A line of best fit should balance the distribution of data points above and below it, following the overall downward trend of the scatter plot.
- (1,10) and (6,6): (1,10) is an outlier high point, so the line would be too steep and not represent most data.
- (1,7) and (2,6): These are clustered on the left, ignoring the right-side data points.
- (3,7) and (7,4): This line would leave most upper-left points above and lower-right points below, creating an uneven fit.
- (3,8) and (6,6): This line follows the downward trend, with a roughly equal number of points above and below it, balancing the data distribution.

Snap & solve any problem in the app
Get step-by-step solutions on Sovi AI
Photo-based solutions with guided steps
Explore more problems and detailed explanations
(3, 8) and (6, 6)