QUESTION IMAGE
Question
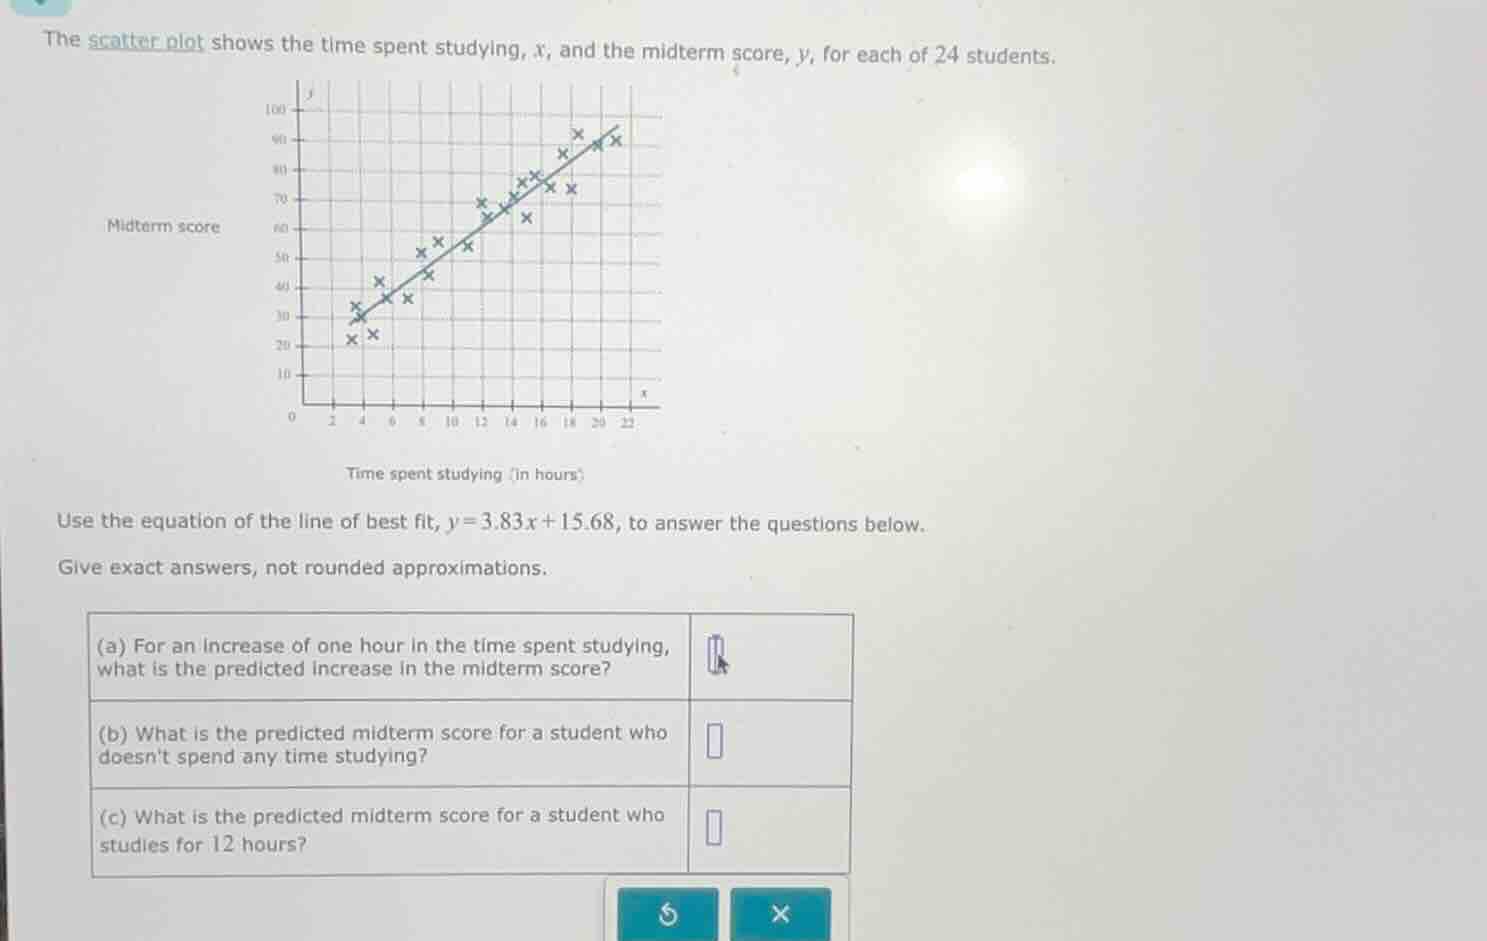
the scatter plot shows the time spent studying, x, and the midterm score, y, for each of 24 students.
midterm score
time spent studying (in hours)
use the equation of the line of best fit, $y = 3.83x + 15.68$, to answer the questions below.
give exact answers, not rounded approximations.
(a) for an increase of one hour in the time spent studying, what is the predicted increase in the midterm score?
(b) what is the predicted midterm score for a student who doesnt spend any time studying?
(c) what is the predicted midterm score for a student who studies for 12 hours?
Step1: Identify slope (rate of change)
The line of best fit is in the form $y=mx+b$, where $m$ is the slope. Here, $m=3.83$.
Step2: Find y-intercept (x=0 case)
When $x=0$ (no study time), $y=b$. Here, $b=15.68$.
Step3: Calculate y when x=12
Substitute $x=12$ into $y=3.83x+15.68$:
$y=3.83(12)+15.68=45.96+15.68$

Snap & solve any problem in the app
Get step-by-step solutions on Sovi AI
Photo-based solutions with guided steps
Explore more problems and detailed explanations
(a) 3.83
(b) 15.68
(c) 61.64