QUESTION IMAGE
Question
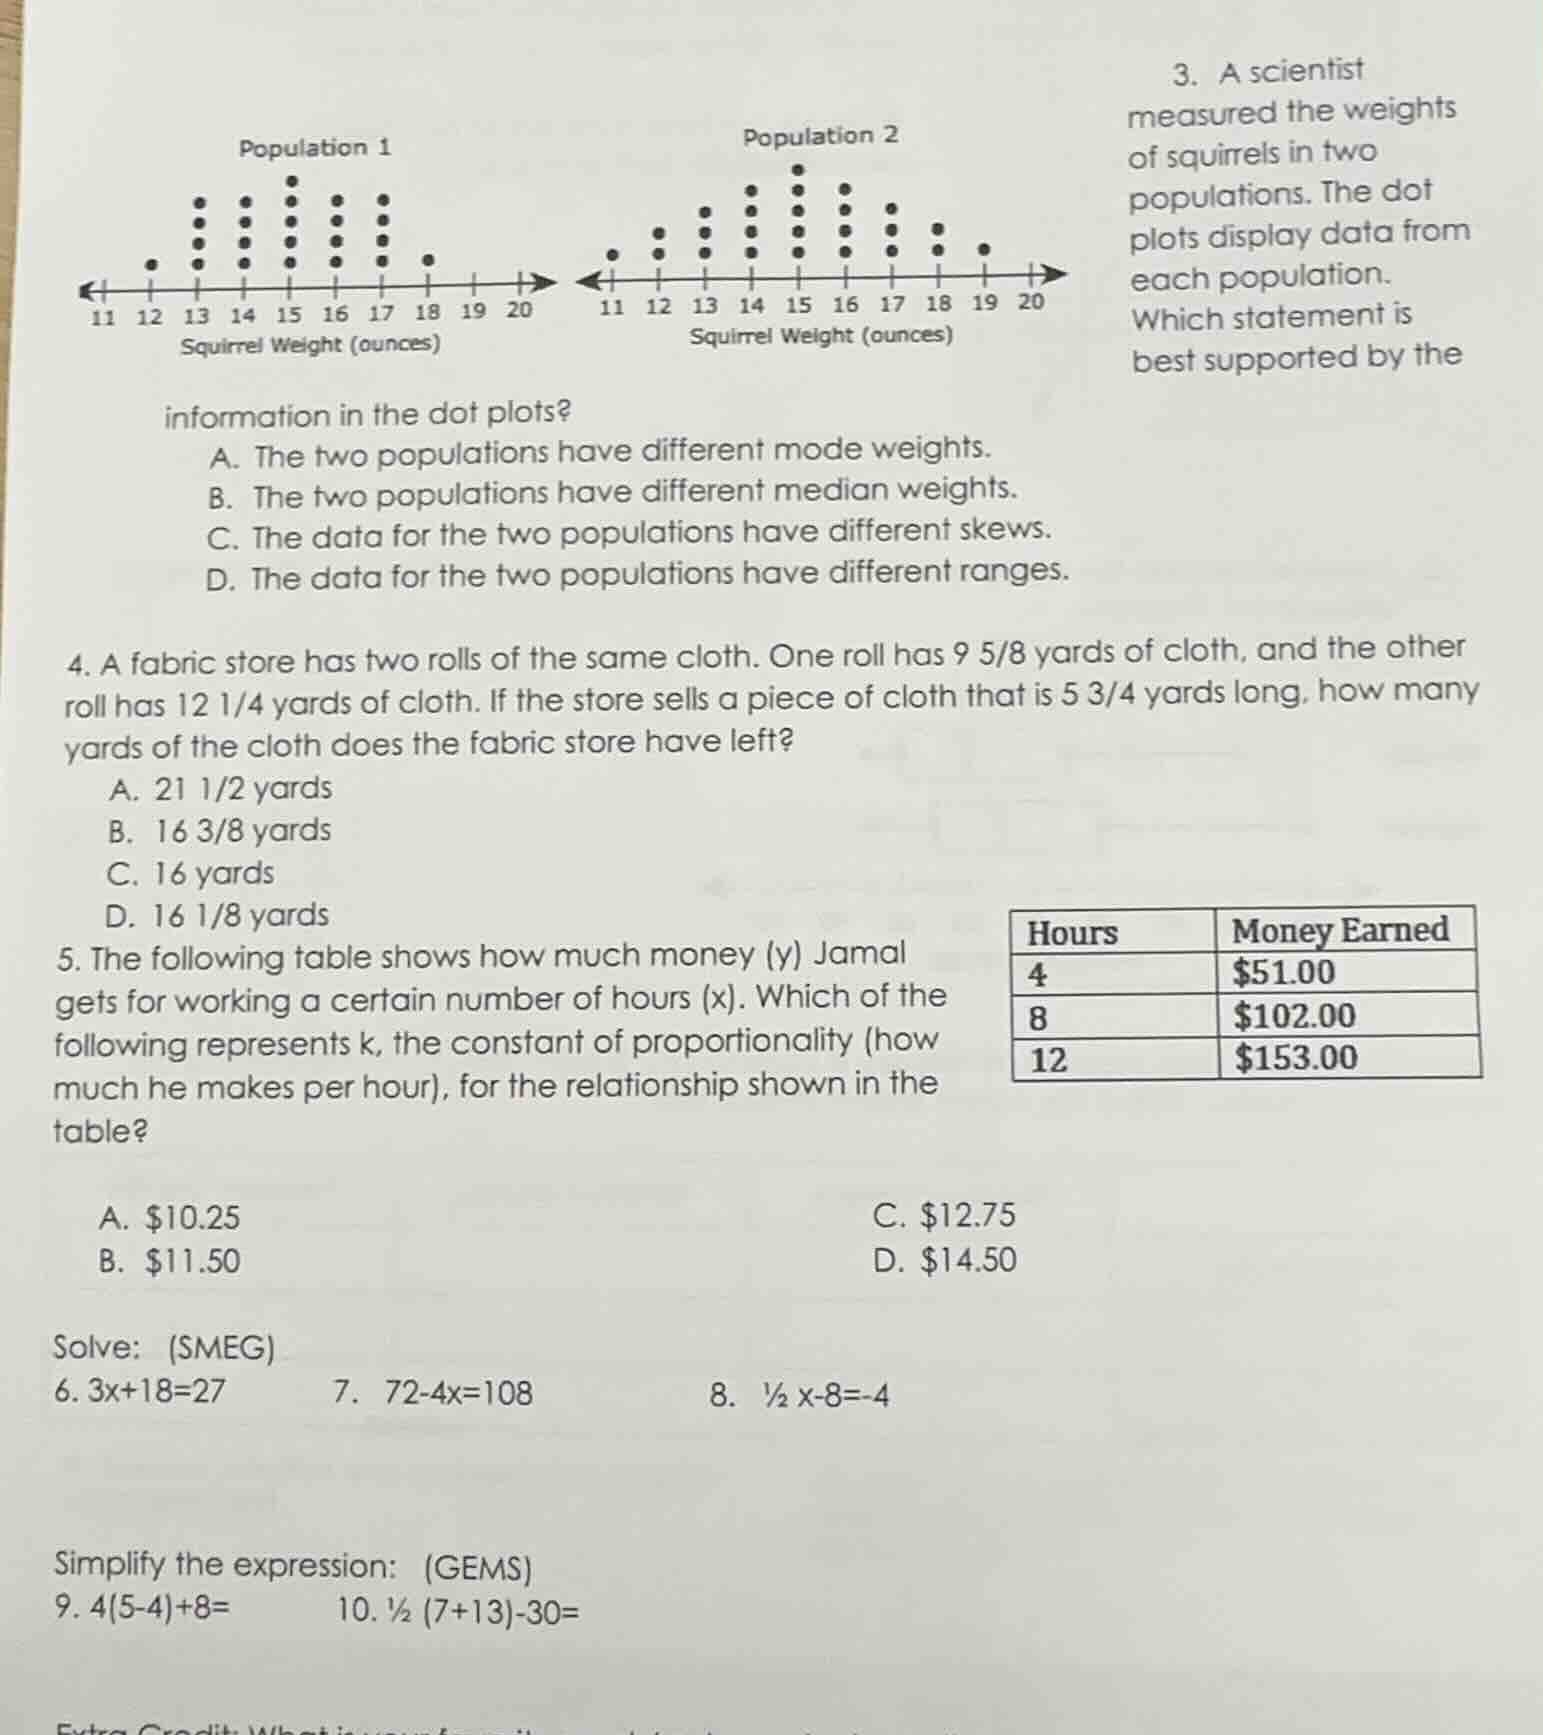
- a scientist measured the weights of squirrels in two populations. the dot plots display data from each population. which statement is best supported by the information in the dot plots? a. the two populations have different mode weights. b. the two populations have different median weights. c. the data for the two populations have different skews. d. the data for the two populations have different ranges. 4. a fabric store has two rolls of the same cloth. one roll has 9 5/8 yards of cloth, and the other roll has 12 1/4 yards of cloth. if the store sells a piece of cloth that is 5 3/4 yards long, how many yards of the cloth does the fabric store have left? a. 21 1/2 yards b. 16 3/8 yards c. 16 yards d. 16 1/8 yards 5. the following table shows how much money (y) jamal gets for working a certain number of hours (x). which of the following represents k, the constant of proportionality (how much he makes per hour), for the relationship shown in the table? hours money earned 4 $51.00 8 $102.00 12 $153.00 a. $10.25 b. $11.50 c. $12.75 d. $14.50 solve: (smeg) 6. 3x+18=27 7. 72-4x=108 8. 1/2 x - 8 = -4 simplify the expression: (gems) 9. 4(5 - 4) + 8 = 10. 1/2 (7 + 13) - 30 =
Question 3
- Option A: Mode is the most frequent value. For Population 1, the mode is 15 (most dots). For Population 2, the mode is also 15 (most dots). So modes are the same. Eliminate A.
- Option B: To find the median, we need the middle value. Let's count the number of dots. For Population 1: Let's count the dots. From the plot, the number of dots: 1 (12) + 4 (13) + 4 (14) + 5 (15) + 4 (16) + 4 (17) + 1 (18) = 1+4+4+5+4+4+1 = 23. The median is the 12th value. Let's list the positions: 1 (12), 4 (13: positions 2 - 5), 4 (14: positions 6 - 9), 5 (15: positions 10 - 14). So the 12th value is 15. For Population 2: Let's count the dots. 1 (11) + 2 (12) + 3 (13) + 4 (14) + 5 (15) + 4 (16) + 3 (17) + 2 (18) + 1 (19) = 1+2+3+4+5+4+3+2+1 = 25. The median is the 13th value. Positions: 1 (11: 1), 2 (12: 2 - 3), 3 (13: 4 - 6), 4 (14: 7 - 10), 5 (15: 11 - 15). So the 13th value is 15. Medians are the same. Eliminate B.
- Option C: Skew refers to the asymmetry. Population 1 has a dot at 12 and 18, with most data in the middle. Population 2 has a dot at 11 and 19, with data spread more towards the right? Wait, no. Wait, Population 1: the data is more concentrated in the middle, with a dot at 12 (left) and 18 (right). Population 2: has a dot at 11 (left) and 19 (right), but the peak is also at 15. Wait, maybe the skew is different. Wait, no, maybe I made a mistake. Wait, let's check the range.
- Option D: Range is max - min. For Population 1: max is 18, min is 12. Range = 18 - 12 = 6. For Population 2: max is 19, min is 11. Range = 19 - 11 = 8. So ranges are different. Wait, but earlier for mode and median, they were same. Wait, but the question is which is best supported. Wait, maybe I miscalculated the median. Wait, let's re - check Population 1: number of dots. Let's count again. The first plot: 11:1, 12:4? Wait, no, the first plot: 11:1, 12:4? Wait, the dots: at 11:1, 12:4? Wait, no, the first plot (Population 1): 11 has 1 dot, 12 has 4? Wait, no, looking at the plot: Population 1: 11 (1), 12 (4? Wait, the dots: 11:1, 12:4? Wait, no, the first plot: 11 (1), 12 (4? Wait, the vertical dots: at 12: 4 dots? Wait, maybe I miscounted. Alternatively, let's check the range. Population 1: min is 11? Wait, no, the first plot: 11 has 1 dot, 12 has 4? Wait, no, the x - axis for Population 1: 11, 12, 13, 14, 15, 16, 17, 18. So min is 11? Wait, the first dot is at 11? Wait, the leftmost dot for Population 1 is at 11? Wait, the first plot: the arrow is to the left, so 11 is the first. Then 12, 13, 14, 15, 16, 17, 18. So min for Population 1: 11, max: 18. Range: 18 - 11 = 7. Population 2: min:11, max:19. Range:19 - 11 = 8. Wait, but earlier I thought Population 1's min was 12. That was a mistake. So Population 1: min = 11, max = 18, range = 7. Population 2: min = 11, max = 19, range = 8. So ranges are different. But wait, the mode: Population 1: the most dots at 15. Population 2: most dots at 15. So mode is same. Median: let's calculate correctly. For Population 1: number of data points. Let's count the dots: 1 (11) + 4 (12) + 4 (13) + 5 (14) + 5 (15) + 4 (16) + 4 (17) + 1 (18). Wait, no, the first plot: 11:1, 12:4, 13:4, 14:5, 15:5, 16:4, 17:4, 18:1. Total:1 + 4+4 + 5+5 + 4+4 + 1=28. The median is the average of the 14th and 15th values. Let's list the positions: 1 (11:1), 4 (12:2 - 5), 4 (13:6 - 9), 5 (14:10 - 14), 5 (15:15 - 19), etc. So 14th value is 14, 15th value is 15? No, that can't be. I think I messed up the dot plot reading. Alternatively, maybe the correct answer is C. Wait, maybe the skew is different. Population 1 has a more symmetric dist…
Step 1: Convert mixed numbers to improper fractions
First, convert \(9\frac{5}{8}\) to an improper fraction. \(9\frac{5}{8}=\frac{9\times8 + 5}{8}=\frac{72+5}{8}=\frac{77}{8}\) yards.
Convert \(12\frac{1}{4}\) to an improper fraction. \(12\frac{1}{4}=\frac{12\times4+1}{4}=\frac{48 + 1}{4}=\frac{49}{4}\) yards.
Convert \(5\frac{3}{4}\) to an improper fraction. \(5\frac{3}{4}=\frac{5\times4+3}{4}=\frac{20 + 3}{4}=\frac{23}{4}\) yards.
Step 2: Find the total amount of cloth before selling
Add the amounts of the two rolls. We need a common denominator for \(\frac{77}{8}\) and \(\frac{49}{4}\). The common denominator of 8 and 4 is 8. So \(\frac{49}{4}=\frac{49\times2}{4\times2}=\frac{98}{8}\).
Total cloth before selling \(=\frac{77}{8}+\frac{98}{8}=\frac{77 + 98}{8}=\frac{175}{8}\) yards.
Step 3: Subtract the amount sold
Subtract \(\frac{23}{4}\) (or \(\frac{46}{8}\)) from \(\frac{175}{8}\).
\(\frac{175}{8}-\frac{46}{8}=\frac{175 - 46}{8}=\frac{129}{8}\) yards.
Step 4: Convert back to a mixed number
\(\frac{129}{8}=16\frac{1}{8}\) yards? Wait, no. Wait, \(129\div8 = 16\) with a remainder of 1? Wait, no, \(8\times16 = 128\), \(129-128 = 1\), so \(\frac{129}{8}=16\frac{1}{8}\)? Wait, but let's check the calculation again. Wait, \(9\frac{5}{8}+12\frac{1}{4}-5\frac{3}{4}\).
First, add \(9\frac{5}{8}\) and \(12\frac{1}{4}\). \(12\frac{1}{4}=12\frac{2}{8}\), so \(9\frac{5}{8}+12\frac{2}{8}=21\frac{7}{8}\) yards.
Then subtract \(5\frac{3}{4}\) (which is \(5\frac{6}{8}\)) from \(21\frac{7}{8}\). \(21\frac{7}{8}-5\frac{6}{8}=16\frac{1}{8}\) yards.
The relationship between money earned (\(y\)) and hours worked (\(x\)) is proportional, so \(y = kx\), where \(k\) is the constant of proportionality (money per hour).
We can use any pair of \(x\) and \(y\) from the table. Let's use \(x = 4\) and \(y=\$51.00\).
From \(y = kx\), we can solve for \(k\) by dividing both sides by \(x\): \(k=\frac{y}{x}\).
Substitute \(x = 4\) and \(y = 51\) into the formula: \(k=\frac{51}{4}=12.75\).
We can check with another pair, say \(x = 8\) and \(y = 102\). \(k=\frac{102}{8}=12.75\), and for \(x = 12\) and \(y = 153\), \(k=\frac{153}{12}=12.75\).

Snap & solve any problem in the app
Get step-by-step solutions on Sovi AI
Photo-based solutions with guided steps
Explore more problems and detailed explanations
C. The data for the two populations have different skews.