QUESTION IMAGE
Question
section 2.2 - histograms, frequency polygons, and ogives
question 8 of 13 (1 point) | question attempt: 1 of unlimited
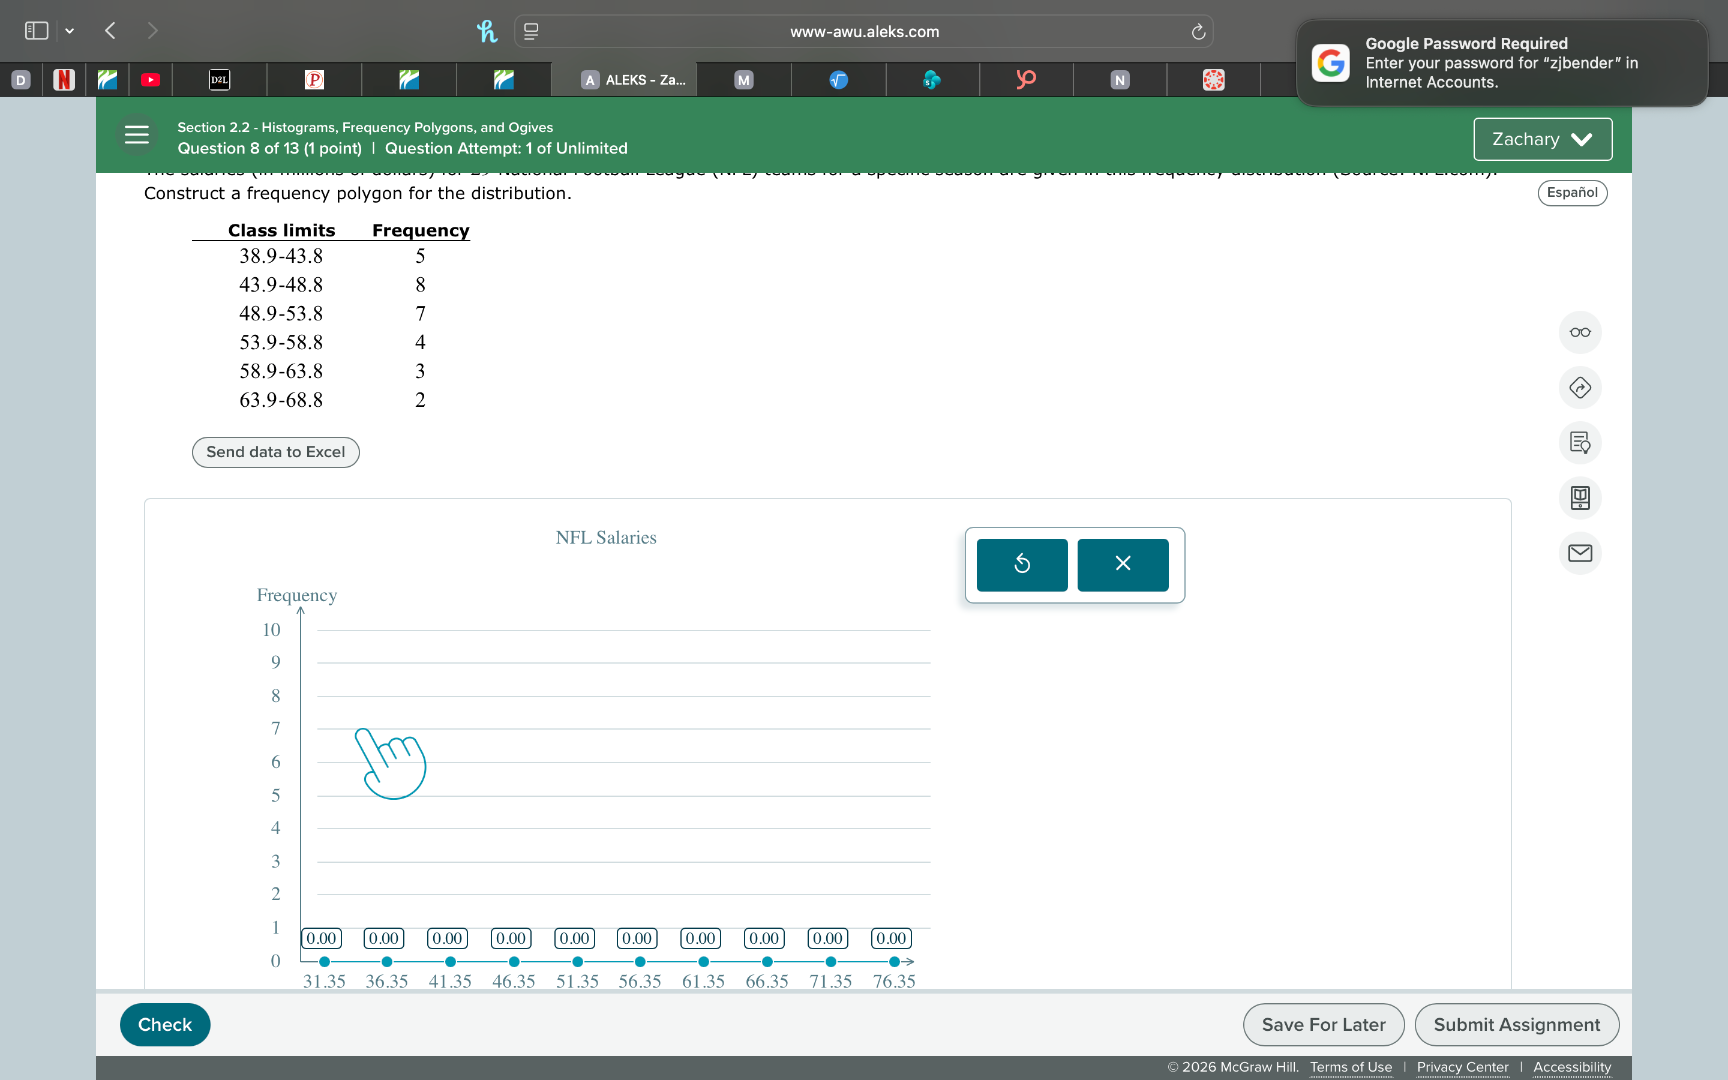
construct a frequency polygon for the distribution.
class limits frequency
38.9 - 43.8 5
43.9 - 48.8 8
48.9 - 53.8 7
53.9 - 58.8 4
58.9 - 63.8 3
63.9 - 68.8 2
send data to excel
nfl salaries
frequency
10
9
8
7
6
5
4
3
2
1
0.00 0.00 0.00 0.00 0.00 0.00 0.00 0.00 0.00 0.00
31.35 36.35 41.35 46.35 51.35 56.35 61.35 66.35 71.35 76.35
check
save for later submit assignment
© 2026 mcgraw hill. terms of use | privacy center | accessibility
Step1: Find class midpoints
For each class, calculate midpoint: $\text{Midpoint} = \frac{\text{Lower Limit} + \text{Upper Limit}}{2}$
- $38.9\text{-}43.8$: $\frac{38.9+43.8}{2}=41.35$
- $43.9\text{-}48.8$: $\frac{43.9+48.8}{2}=46.35$
- $48.9\text{-}53.8$: $\frac{48.9+53.8}{2}=51.35$
- $53.9\text{-}58.8$: $\frac{53.9+58.8}{2}=56.35$
- $58.9\text{-}63.8$: $\frac{58.9+63.8}{2}=61.35$
- $63.9\text{-}68.8$: $\frac{63.9+68.8}{2}=66.35$
Step2: Find end midpoints
Calculate midpoints for empty classes at the start/end to anchor the polygon to the x-axis:
- Preceding class: $\text{Midpoint}=41.35-(46.35-41.35)=31.35$ (frequency=0)
- Following class: $\text{Midpoint}=66.35+(66.35-61.35)=71.35$ (frequency=0)
Step3: Plot and connect points
Plot pairs (midpoint, frequency):
$(31.35,0)$, $(41.35,5)$, $(46.35,8)$, $(51.35,7)$, $(56.35,4)$, $(61.35,3)$, $(66.35,2)$, $(71.35,0)$
Connect the points in sequence with straight lines.

Snap & solve any problem in the app
Get step-by-step solutions on Sovi AI
Photo-based solutions with guided steps
Explore more problems and detailed explanations
The frequency polygon is constructed by plotting the following points and connecting them in order, plus connecting to the x-axis at the start/end:
(31.35, 0), (41.35, 5), (46.35, 8), (51.35, 7), (56.35, 4), (61.35, 3), (66.35, 2), (71.35, 0)