QUESTION IMAGE
Question
section 2.2 - histograms, frequency polygons, and ogives
question 5 of 13 (1 point) | question attempt: 1 of unlimited
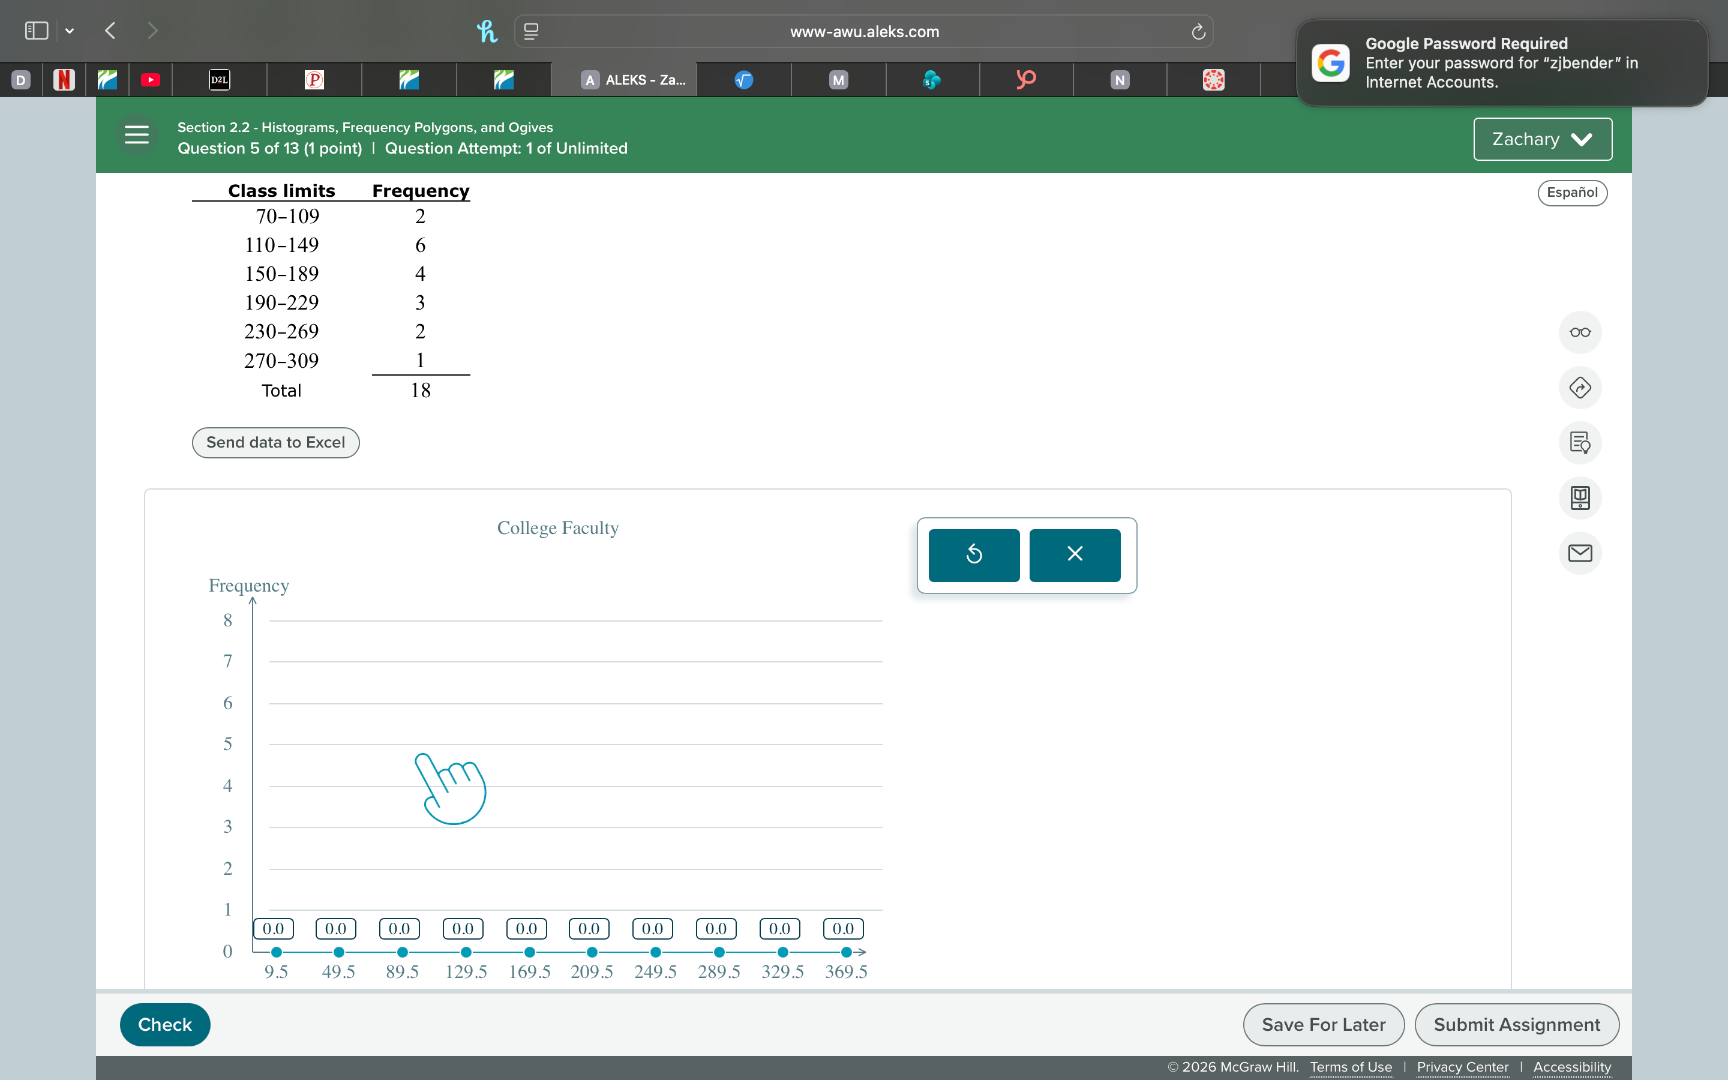
class limits frequency
70–109 2
110–149 6
150–189 4
190–229 3
230–269 2
270–309 1
total 18
send data to excel
college faculty
frequency
8
7
6
5
4
3
2
1
0
9.5 49.5 89.5 129.5 169.5 209.5 249.5 289.5 329.5 369.5
check save for later submit assignment
© 2026 mcgraw hill. terms of use | privacy center | accessibility
Step1: Find class midpoints
For each class:
- $70$-$109$: $\frac{70+109}{2}=89.5$
- $110$-$149$: $\frac{110+149}{2}=129.5$
- $150$-$189$: $\frac{150+189}{2}=169.5$
- $190$-$229$: $\frac{190+229}{2}=209.5$
- $230$-$269$: $\frac{230+269}{2}=249.5$
- $270$-$309$: $\frac{270+309}{2}=289.5$
Step2: Add extra end classes
Add two additional classes with frequency 0:
- Lower class: $30$-$69$, midpoint $\frac{30+69}{2}=49.5$
- Upper class: $310$-$349$, midpoint $\frac{310+349}{2}=329.5$
Step3: Plot midpoints vs frequency
Plot the following points on the graph:
- $(49.5, 0)$
- $(89.5, 2)$
- $(129.5, 6)$
- $(169.5, 4)$
- $(209.5, 3)$
- $(249.5, 2)$
- $(289.5, 1)$
- $(329.5, 0)$
Step4: Connect plotted points
Draw straight lines between consecutive plotted points to form the frequency polygon.

Snap & solve any problem in the app
Get step-by-step solutions on Sovi AI
Photo-based solutions with guided steps
Explore more problems and detailed explanations
A completed frequency polygon for the given data