QUESTION IMAGE
Question
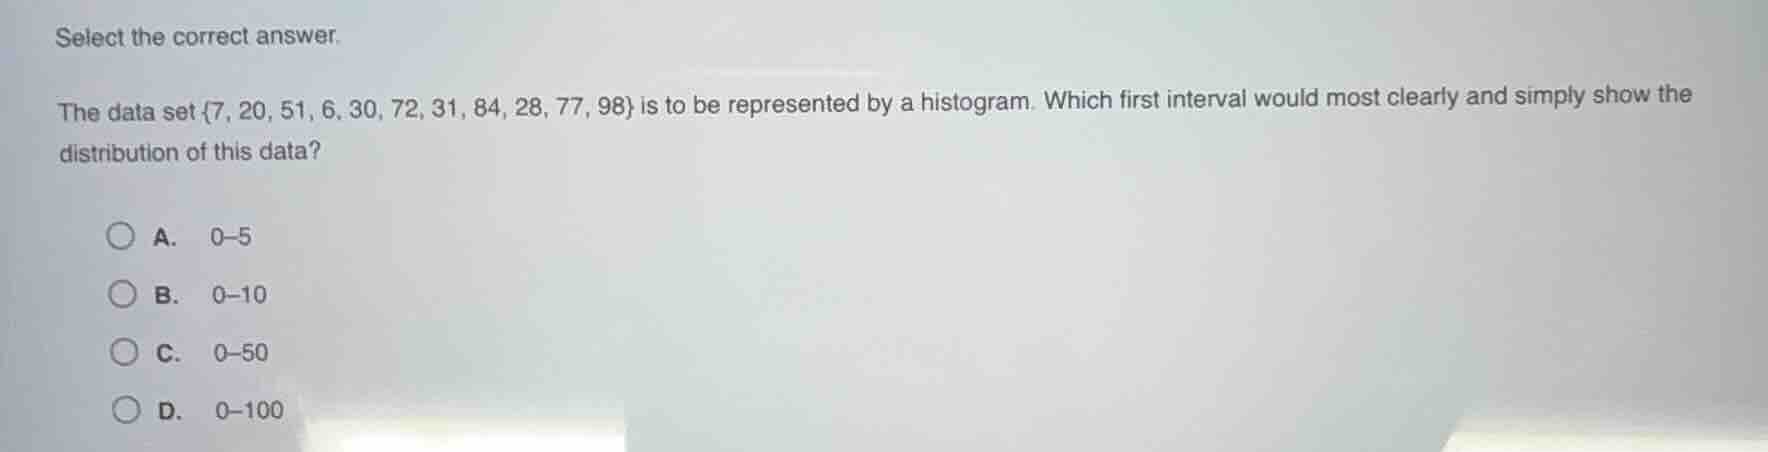
select the correct answer. the data set {7, 20, 51, 6, 30, 72, 31, 84, 28, 77, 98} is to be represented by a histogram. which first interval would most clearly and simply show the distribution of this data? a. 0–5 b. 0–10 c. 0–50 d. 0–100
Step1: Identify min/max data values
Minimum value: $6$, Maximum value: $98$
Step2: Evaluate interval suitability
- A. $0$–$5$: No data points here, useless for first interval.
- B. $0$–$10$: Captures the two smallest values ($6,7$), is narrow enough to show detail, and starts at a clean lower bound.
- C. $0$–$50$: Too wide, groups most data into one interval, hides distribution detail.
- D. $0$–$100$: Covers all data but is overly broad, shows no meaningful distribution.

Snap & solve any problem in the app
Get step-by-step solutions on Sovi AI
Photo-based solutions with guided steps
Explore more problems and detailed explanations
B. 0–10