QUESTION IMAGE
Question
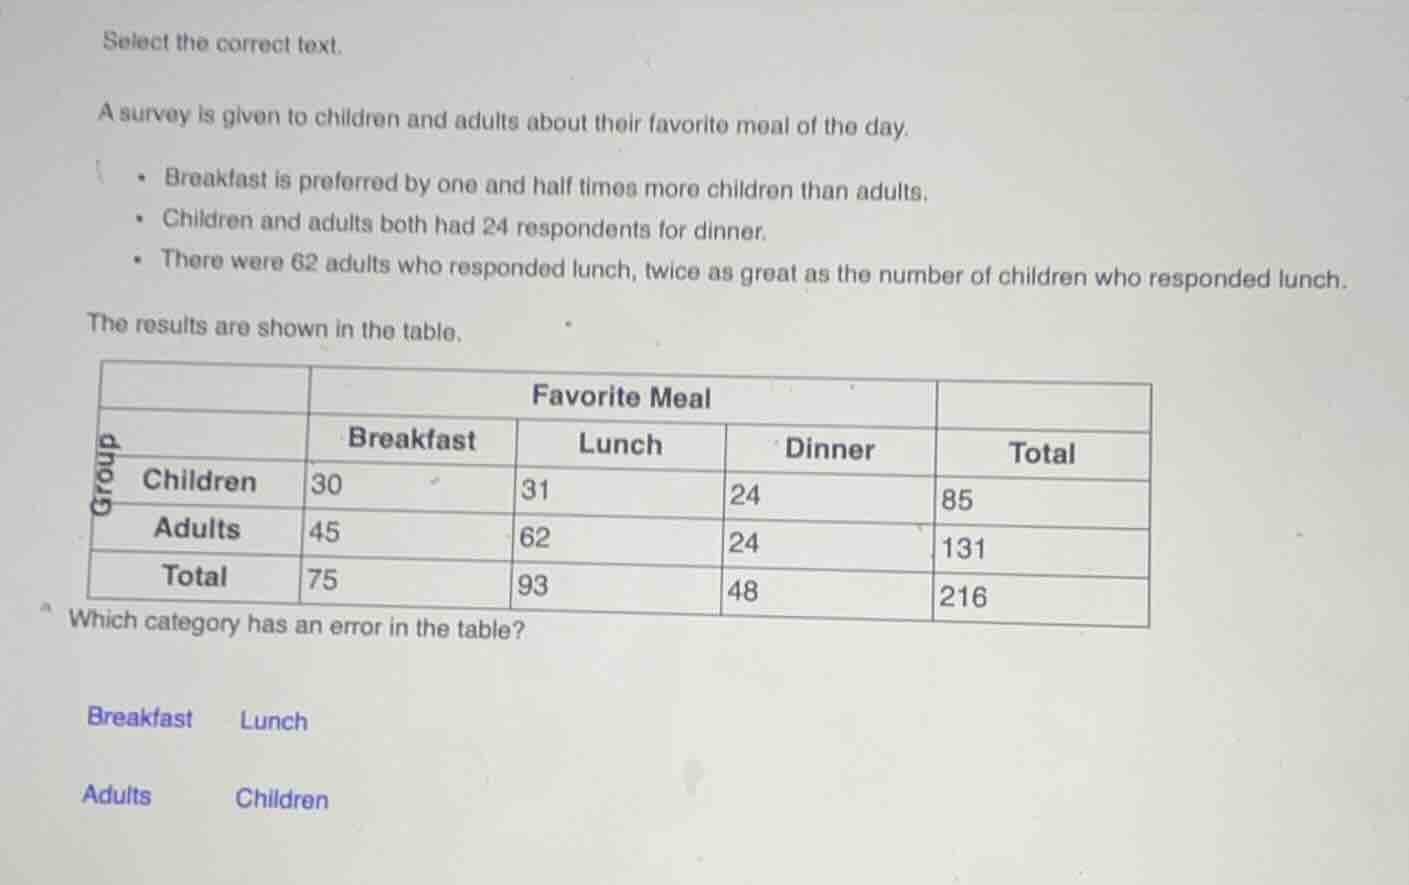
select the correct text.
a survey is given to children and adults about their favorite meal of the day.
- breakfast is preferred by one and half times more children than adults.
- children and adults both had 24 respondents for dinner.
- there were 62 adults who responded lunch, twice as great as the number of children who responded lunch.
the results are shown in the table.
| favorite meal | ||||
| group | breakfast | lunch | dinner | total |
| children | 30 | 31 | 24 | 85 |
| adults | 45 | 62 | 24 | 131 |
| total | 75 | 93 | 48 | 216 |
which category has an error in the table?
breakfast lunch
adults children
Step1: Verify Breakfast data
Given: Children who prefer breakfast = 1.5 × Adults who prefer breakfast.
Let adult breakfast count = $A$, child breakfast count = $1.5A$.
If $A=45$, then $1.5\times45=67.5$, not 30. If child count=30, adult count = $\frac{30}{1.5}=20$, not 45. The table has a mismatch here.
Step2: Verify Lunch data
Given: Adult lunch count = 2 × Child lunch count.
Adult lunch count = 62, so child lunch count should be $\frac{62}{2}=31$, which matches the table.
Step3: Verify Dinner data
Given: Children and adults both have 24 dinner respondents, which matches the table.
Step4: Verify Total counts
Children total: $30+31+24=85$ (matches). Adults total: $45+62+24=131$ (matches). Overall total: $85+131=216$ (matches).

Snap & solve any problem in the app
Get step-by-step solutions on Sovi AI
Photo-based solutions with guided steps
Explore more problems and detailed explanations
Breakfast