QUESTION IMAGE
Question
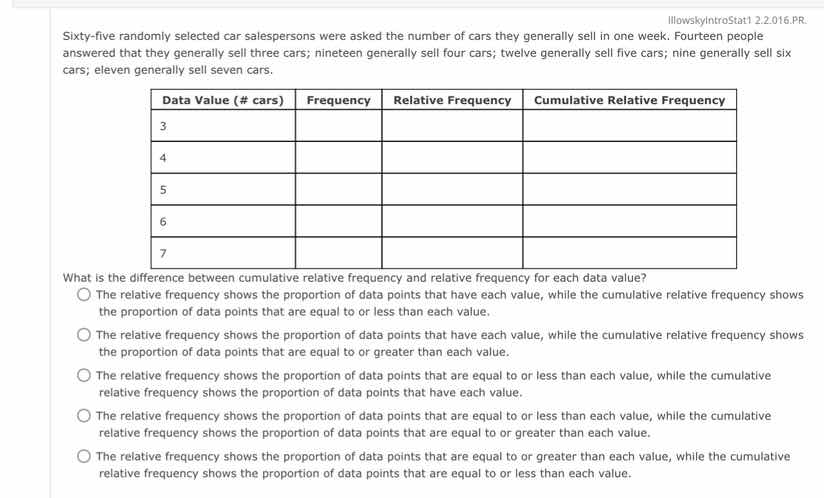
sixty - five randomly selected car salespersons were asked the number of cars they generally sell in one week. fourteen people answered that they generally sell three cars; nineteen generally sell four cars; twelve generally sell five cars; nine generally sell six cars; eleven generally sell seven cars.
| data value (# cars) | frequency | relative frequency | cumulative relative frequency |
|---|---|---|---|
| 4 | |||
| 5 | |||
| 6 | |||
| 7 |
what is the difference between cumulative relative frequency and relative frequency for each data value?
- the relative frequency shows the proportion of data points that have each value, while the cumulative relative frequency shows the proportion of data points that are equal to or less than each value.
- the relative frequency shows the proportion of data points that have each value, while the cumulative relative frequency shows the proportion of data points that are equal to or greater than each value.
- the relative frequency shows the proportion of data points that are equal to or less than each value, while the cumulative relative frequency shows the proportion of data points that have each value.
- the relative frequency shows the proportion of data points that are equal to or less than each value, while the cumulative relative frequency shows the proportion of data points that are equal to or greater than each value.
- the relative frequency shows the proportion of data points that are equal to or greater than each value, while the cumulative relative frequency shows the proportion of data points that are equal to or less than each value.
To determine the difference between relative frequency and cumulative relative frequency, we recall their definitions:
- Relative Frequency: For a particular data value, it is the proportion of data points that have that specific value. It is calculated as $\frac{\text{Frequency of the data value}}{\text{Total number of data points}}$.
- Cumulative Relative Frequency: For a particular data value, it is the proportion of data points that are equal to or less than that value. It is calculated by summing the relative frequencies of all data values up to and including the current one.
Now let's analyze each option:
- Option 1: Matches the definitions of relative frequency (proportion with each value) and cumulative relative frequency (proportion equal to or less than each value).
- Option 2: Cumulative relative frequency is not about "equal to or greater than" – that would be a different type of cumulative frequency (e.g., cumulative relative frequency from the top). So this is incorrect.
- Option 3: Swaps the definitions. Relative frequency is not about "equal to or less than" and cumulative relative frequency is not about "having each value". Incorrect.
- Option 4: Relative frequency is not about "equal to or less than" and cumulative relative frequency is not about "equal to or greater than" (in the standard cumulative from the bottom sense). Incorrect.
- Option 5: Relative frequency is not about "equal to or greater than" and cumulative relative frequency is about "equal to or less than", but the definition of relative frequency here is wrong. Incorrect.

Snap & solve any problem in the app
Get step-by-step solutions on Sovi AI
Photo-based solutions with guided steps
Explore more problems and detailed explanations
A. The relative frequency shows the proportion of data points that have each value, while the cumulative relative frequency shows the proportion of data points that are equal to or less than each value.