QUESTION IMAGE
Question
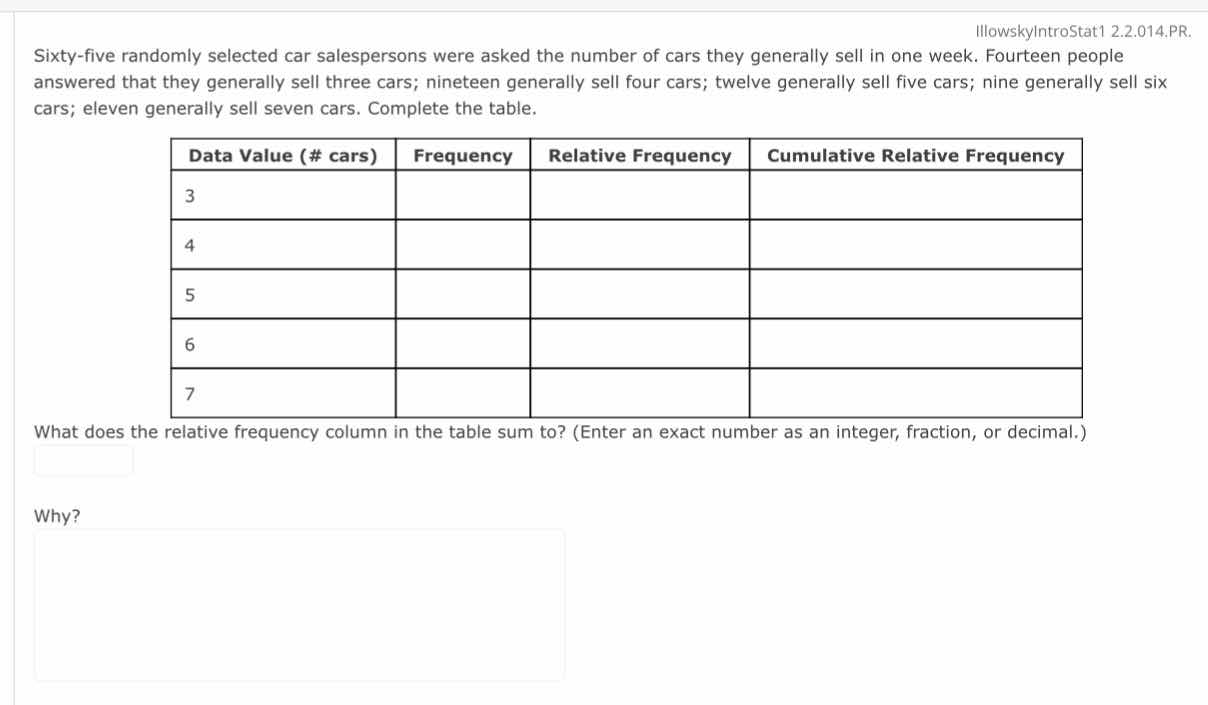
sixty - five randomly selected car salespersons were asked the number of cars they generally sell in one week. fourteen people answered that they generally sell three cars; nineteen generally sell four cars; twelve generally sell five cars; nine generally sell six cars; eleven generally sell seven cars. complete the table.
| data value (# cars) | frequency | relative frequency | cumulative relative frequency |
|---|---|---|---|
| 4 | |||
| 5 | |||
| 6 | |||
| 7 |
what does the relative frequency column in the table sum to? (enter an exact number as an integer, fraction, or decimal.)
why?
Part 1: Completing the Table
First, let's recall the definitions:
- Frequency: The number of times a data value occurs.
- Relative Frequency: Frequency divided by the total number of observations (here, total number of salespersons, which is 65).
- Cumulative Relative Frequency: Sum of relative frequencies up to that data value.
Total number of salespersons: \( 14 + 19 + 12 + 9 + 11 = 65 \) (let's verify: \( 14+19=33 \), \( 33+12=45 \), \( 45+9=54 \), \( 54+11=65 \))
For Data Value 3:
- Frequency: 14 (given)
- Relative Frequency: \( \frac{14}{65} \approx 0.2154 \)
- Cumulative Relative Frequency: \( \frac{14}{65} \approx 0.2154 \)
For Data Value 4:
- Frequency: 19 (given)
- Relative Frequency: \( \frac{19}{65} \approx 0.2923 \)
- Cumulative Relative Frequency: \( \frac{14 + 19}{65} = \frac{33}{65} \approx 0.5077 \)
For Data Value 5:
- Frequency: 12 (given)
- Relative Frequency: \( \frac{12}{65} \approx 0.1846 \)
- Cumulative Relative Frequency: \( \frac{33 + 12}{65} = \frac{45}{65} \approx 0.6923 \)
For Data Value 6:
- Frequency: 9 (given)
- Relative Frequency: \( \frac{9}{65} \approx 0.1385 \)
- Cumulative Relative Frequency: \( \frac{45 + 9}{65} = \frac{54}{65} \approx 0.8308 \)
For Data Value 7:
- Frequency: 11 (given)
- Relative Frequency: \( \frac{11}{65} \approx 0.1692 \)
- Cumulative Relative Frequency: \( \frac{54 + 11}{65} = \frac{65}{65} = 1 \)
So the table becomes:
| Data Value (# cars) | Frequency | Relative Frequency | Cumulative Relative Frequency |
|---|---|---|---|
| 4 | 19 | \( \frac{19}{65} \) (≈0.2923) | \( \frac{33}{65} \) (≈0.5077) |
| 5 | 12 | \( \frac{12}{65} \) (≈0.1846) | \( \frac{45}{65} \) (≈0.6923) |
| 6 | 9 | \( \frac{9}{65} \) (≈0.1385) | \( \frac{54}{65} \) (≈0.8308) |
| 7 | 11 | \( \frac{11}{65} \) (≈0.1692) | 1 |
Part 2: Sum of Relative Frequency Column
Step 1: Recall the formula for relative frequency
Relative frequency for each data value \( i \) is \( \text{RF}_i = \frac{\text{Frequency}_i}{\text{Total}} \)
Step 2: Sum of all relative frequencies
The sum of relative frequencies is \( \sum \text{RF}_i = \sum \frac{\text{Frequency}_i}{\text{Total}} \)
Since \( \sum \text{Frequency}_i = \text{Total} \) (by definition, the sum of frequencies is the total number of observations), we have:
\( \sum \text{RF}_i = \frac{\sum \text{Frequency}_i}{\text{Total}} = \frac{\text{Total}}{\text{Total}} = 1 \)
Alternatively, we can calculate the sum of the relative frequencies we found:
\( \frac{14}{65} + \frac{19}{65} + \frac{12}{65} + \frac{9}{65} + \frac{11}{65} = \frac{14 + 19 + 12 + 9 + 11}{65} = \frac{65}{65} = 1 \)
Part 3: Why?
Relative frequency represents the proportion of each data value in the entire dataset. Since we are considering all data values (the entire sample), the sum of their proportions should equal 1 (or 100% if expressed as a percentage). This is because the sum of the frequencies of all data values is equal to the total number of observations, so when we divide each frequency by the total and sum them, we are essentially summing up fractions that represent the entire dataset, which must equal 1.
Final Answers
- The table is completed as shown above.
- The sum of the relative frequency column is \( \boldsymbol{1} \).
- T…

Snap & solve any problem in the app
Get step-by-step solutions on Sovi AI
Photo-based solutions with guided steps
Explore more problems and detailed explanations
Part 1: Completing the Table
First, let's recall the definitions:
- Frequency: The number of times a data value occurs.
- Relative Frequency: Frequency divided by the total number of observations (here, total number of salespersons, which is 65).
- Cumulative Relative Frequency: Sum of relative frequencies up to that data value.
Total number of salespersons: \( 14 + 19 + 12 + 9 + 11 = 65 \) (let's verify: \( 14+19=33 \), \( 33+12=45 \), \( 45+9=54 \), \( 54+11=65 \))
For Data Value 3:
- Frequency: 14 (given)
- Relative Frequency: \( \frac{14}{65} \approx 0.2154 \)
- Cumulative Relative Frequency: \( \frac{14}{65} \approx 0.2154 \)
For Data Value 4:
- Frequency: 19 (given)
- Relative Frequency: \( \frac{19}{65} \approx 0.2923 \)
- Cumulative Relative Frequency: \( \frac{14 + 19}{65} = \frac{33}{65} \approx 0.5077 \)
For Data Value 5:
- Frequency: 12 (given)
- Relative Frequency: \( \frac{12}{65} \approx 0.1846 \)
- Cumulative Relative Frequency: \( \frac{33 + 12}{65} = \frac{45}{65} \approx 0.6923 \)
For Data Value 6:
- Frequency: 9 (given)
- Relative Frequency: \( \frac{9}{65} \approx 0.1385 \)
- Cumulative Relative Frequency: \( \frac{45 + 9}{65} = \frac{54}{65} \approx 0.8308 \)
For Data Value 7:
- Frequency: 11 (given)
- Relative Frequency: \( \frac{11}{65} \approx 0.1692 \)
- Cumulative Relative Frequency: \( \frac{54 + 11}{65} = \frac{65}{65} = 1 \)
So the table becomes:
| Data Value (# cars) | Frequency | Relative Frequency | Cumulative Relative Frequency |
|---|---|---|---|
| 4 | 19 | \( \frac{19}{65} \) (≈0.2923) | \( \frac{33}{65} \) (≈0.5077) |
| 5 | 12 | \( \frac{12}{65} \) (≈0.1846) | \( \frac{45}{65} \) (≈0.6923) |
| 6 | 9 | \( \frac{9}{65} \) (≈0.1385) | \( \frac{54}{65} \) (≈0.8308) |
| 7 | 11 | \( \frac{11}{65} \) (≈0.1692) | 1 |
Part 2: Sum of Relative Frequency Column
Step 1: Recall the formula for relative frequency
Relative frequency for each data value \( i \) is \( \text{RF}_i = \frac{\text{Frequency}_i}{\text{Total}} \)
Step 2: Sum of all relative frequencies
The sum of relative frequencies is \( \sum \text{RF}_i = \sum \frac{\text{Frequency}_i}{\text{Total}} \)
Since \( \sum \text{Frequency}_i = \text{Total} \) (by definition, the sum of frequencies is the total number of observations), we have:
\( \sum \text{RF}_i = \frac{\sum \text{Frequency}_i}{\text{Total}} = \frac{\text{Total}}{\text{Total}} = 1 \)
Alternatively, we can calculate the sum of the relative frequencies we found:
\( \frac{14}{65} + \frac{19}{65} + \frac{12}{65} + \frac{9}{65} + \frac{11}{65} = \frac{14 + 19 + 12 + 9 + 11}{65} = \frac{65}{65} = 1 \)
Part 3: Why?
Relative frequency represents the proportion of each data value in the entire dataset. Since we are considering all data values (the entire sample), the sum of their proportions should equal 1 (or 100% if expressed as a percentage). This is because the sum of the frequencies of all data values is equal to the total number of observations, so when we divide each frequency by the total and sum them, we are essentially summing up fractions that represent the entire dataset, which must equal 1.
Final Answers
- The table is completed as shown above.
- The sum of the relative frequency column is \( \boldsymbol{1} \).
- The sum is 1 because the relative frequencies represent the proportions of each data value in the entire dataset, and the sum of all proportions of a dataset must equal 1 (since they account for the entire set of observations).