QUESTION IMAGE
Question
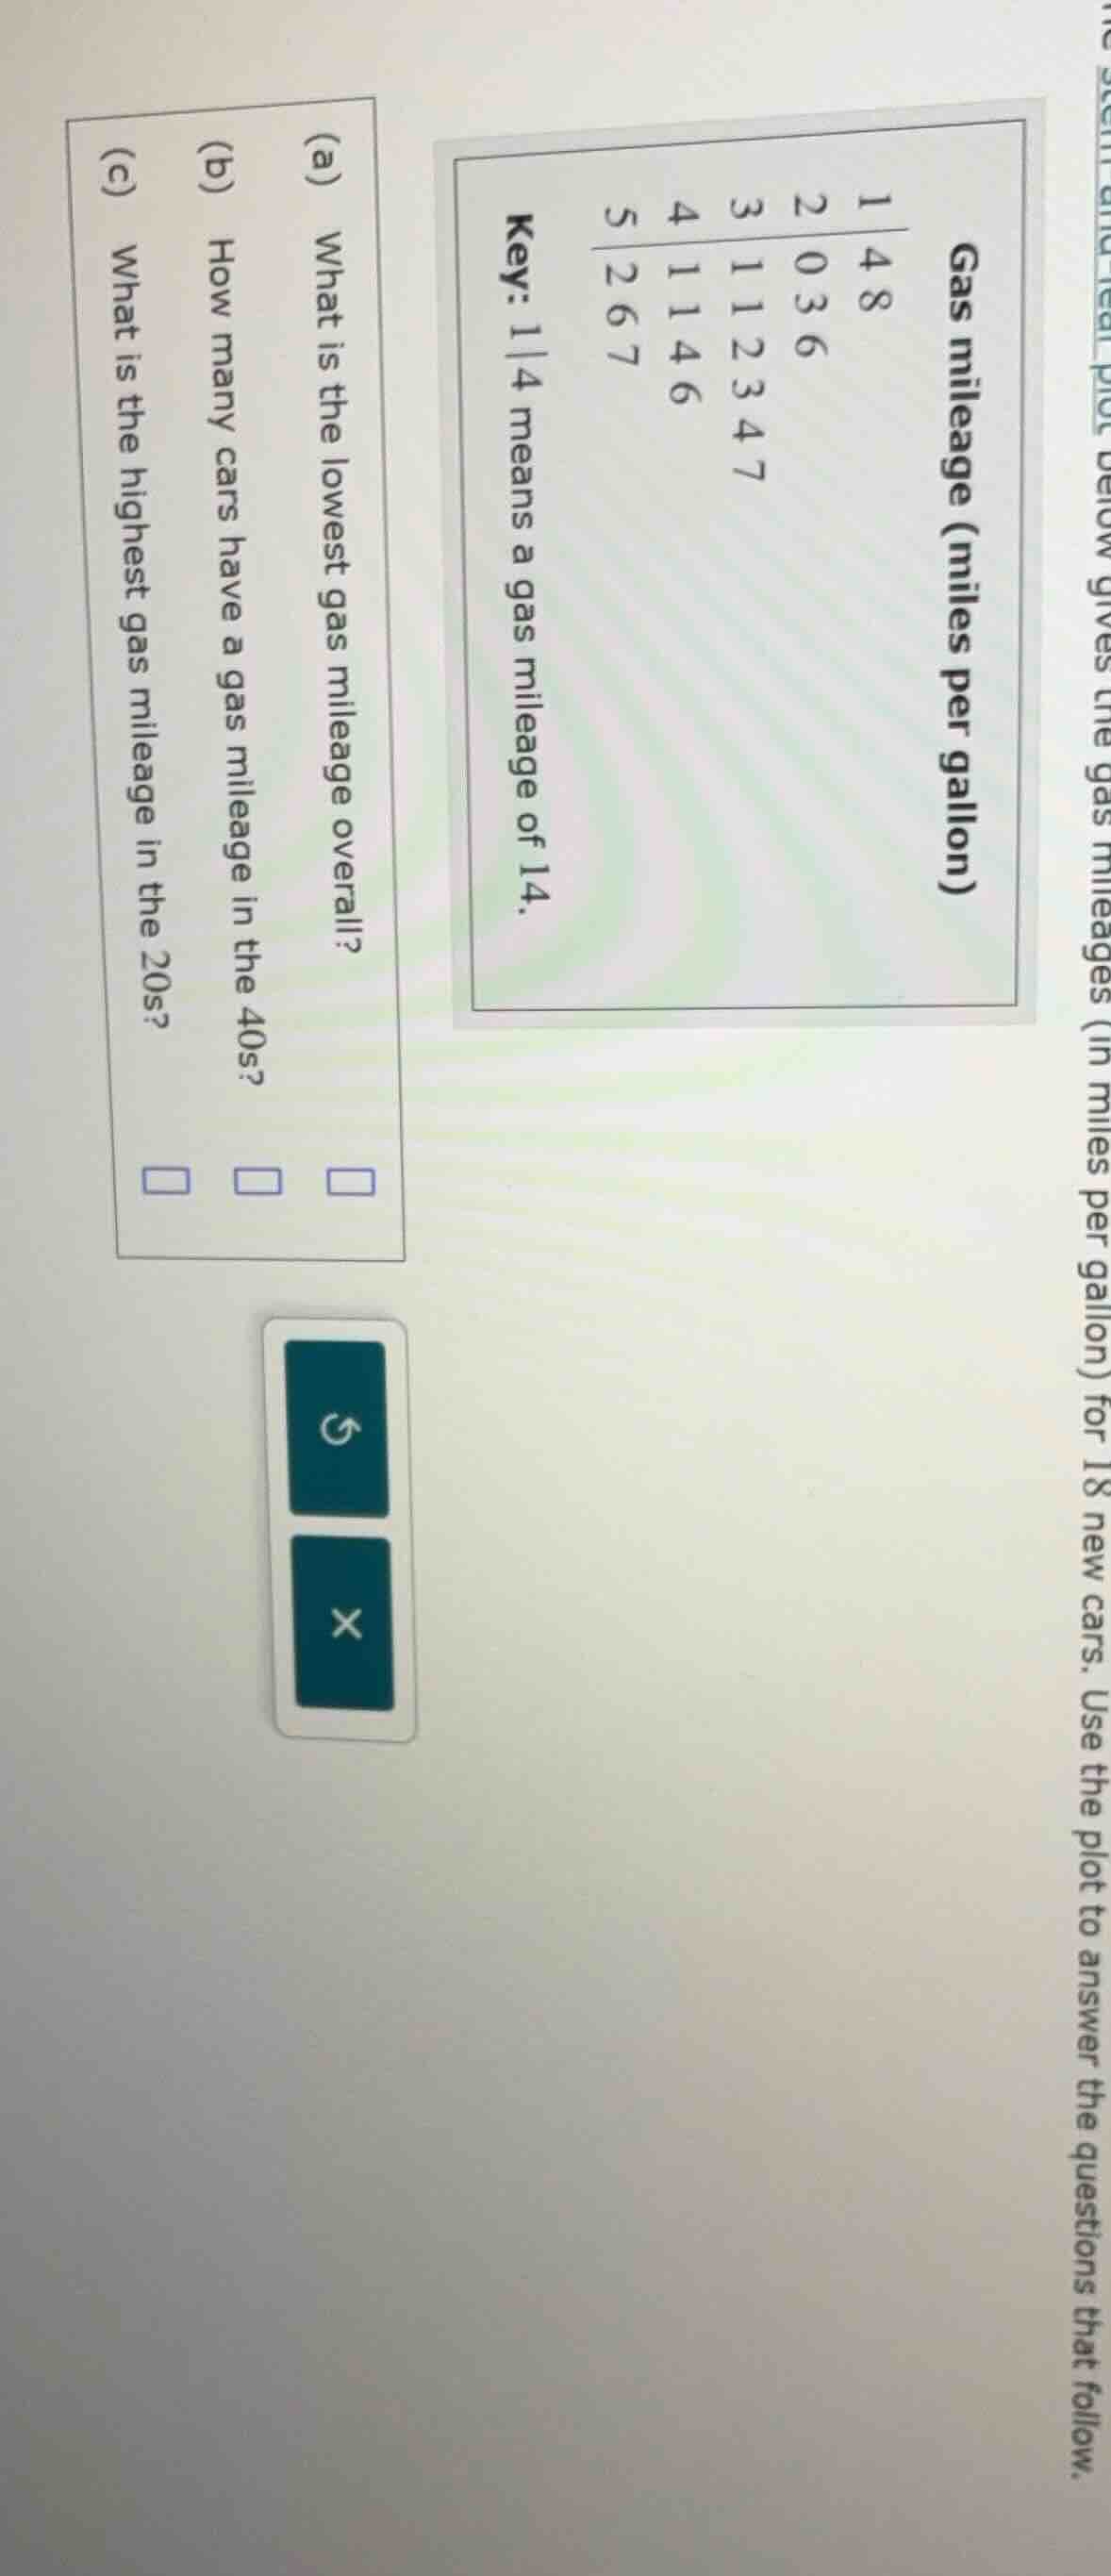
the stem-and-leaf plot below gives the gas mileages (in miles per gallon) for 18 new cars. use the plot to answer the questions that follow.
gas mileage (miles per gallon)
1|4 8
2|0 3 6
3|1 1 2 3 4 7
4|1 1 4 6
5|2 6 7
key: 1|4 means a gas mileage of 14.
(a) what is the lowest gas mileage overall?
(b) how many cars have a gas mileage in the 40s?
(c) what is the highest gas mileage in the 20s?
Step1: Find lowest gas mileage
Using the key, the first row is 1|4,8, so the lowest value is 14.
Step2: Count cars in 40s
Row 4|1,1,4,6 has 4 data points, so 4 cars.
Step3: Find highest in 20s
Row 2|0,3,6: the largest value is 26.

Snap & solve any problem in the app
Get step-by-step solutions on Sovi AI
Photo-based solutions with guided steps
Explore more problems and detailed explanations
(a) 14
(b) 4
(c) 26