QUESTION IMAGE
Question
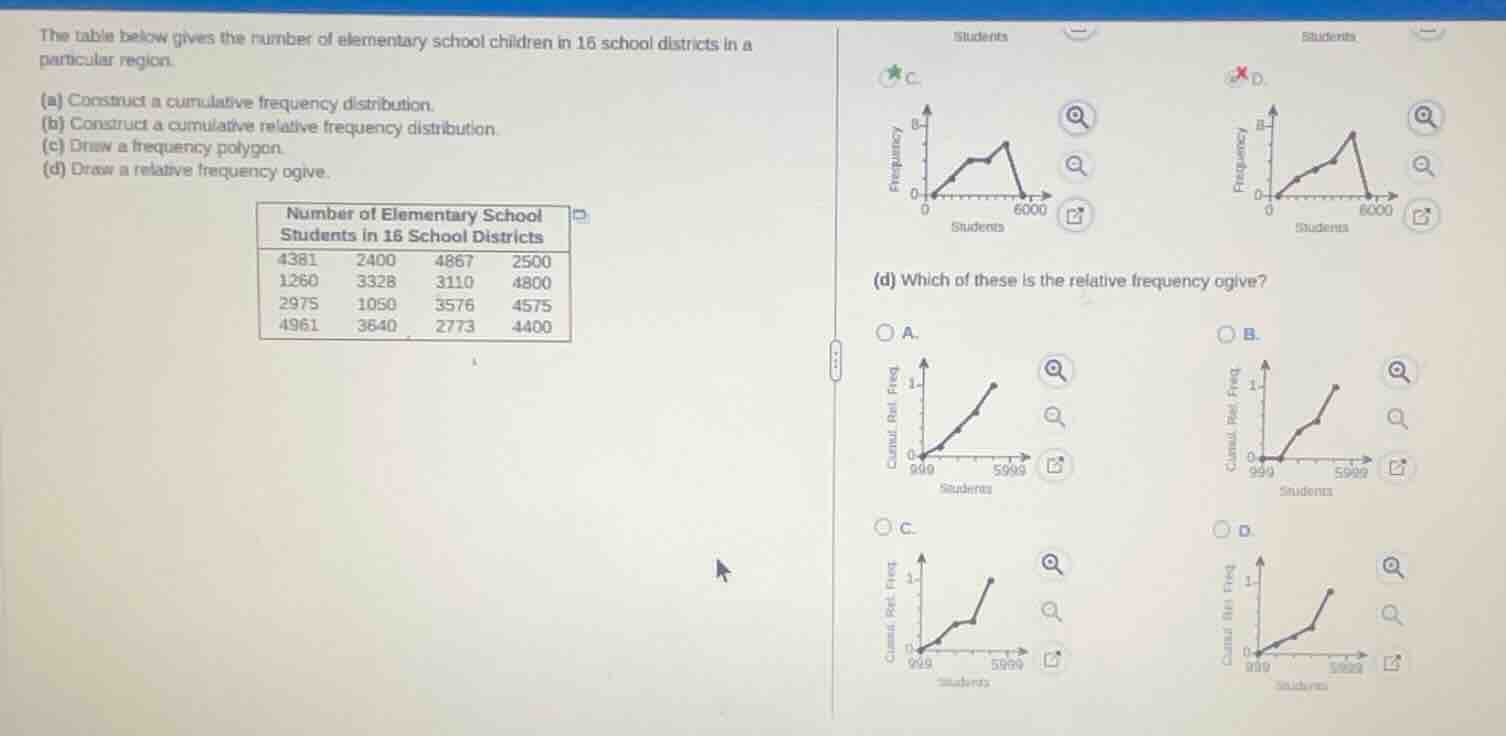
the table below gives the number of elementary school children in 16 school districts in a particular region.
(a) construct a cumulative frequency distribution.
(b) construct a cumulative relative frequency distribution.
(c) draw a frequency polygon.
(d) draw a relative frequency ogive.
number of elementary school students in 16 school districts
4381 2400 4867 2500
1260 3328 3110 4800
2975 1050 3576 4575
4961 3640 2773 4400
(d) which of these is the relative frequency ogive?
a.
graph of cumulative relative frequency
b.
graph of cumulative relative frequency
c.
graph of cumulative relative frequency
d.
graph of cumulative relative frequency
To solve part (d) about identifying the relative frequency ogive, we first recall that a relative frequency ogive is a cumulative relative frequency graph, which should be a non - decreasing curve (since cumulative relative frequency always increases or stays the same as we consider more data). It starts at 0 (when there are no data points) and approaches 1 as we include all data points.
Step 1: Recall the properties of a relative frequency ogive
A relative frequency ogive is a graph of the cumulative relative frequency. The cumulative relative frequency starts at 0 (for the first class with no data before it) and increases monotonically (non - decreasing) until it reaches 1 (when all data is included).
Step 2: Analyze the options
- Option A: The curve is non - decreasing and starts from 0, which is consistent with the behavior of a cumulative relative frequency ogive. As we move along the x - axis (number of students), the cumulative relative frequency (y - axis) should keep increasing or stay the same.
- Option B: The graph does not start from 0 in a way that is consistent with a cumulative relative frequency ogive. The initial point is not at 0 for the cumulative relative frequency.
- Option C: The graph has a non - smooth and non - typical cumulative relative frequency behavior. The jumps and the overall shape do not match the expected monotonic increase of a cumulative relative frequency ogive.
- Option D: Similar to option C, the shape of the graph is not consistent with the expected shape of a cumulative relative frequency ogive. The non - monotonic or irregular shape is not what we expect from a cumulative relative frequency distribution.

Snap & solve any problem in the app
Get step-by-step solutions on Sovi AI
Photo-based solutions with guided steps
Explore more problems and detailed explanations
A. (The option with the non - decreasing curve starting from 0 and approaching 1 as the number of students increases)