QUESTION IMAGE
Question
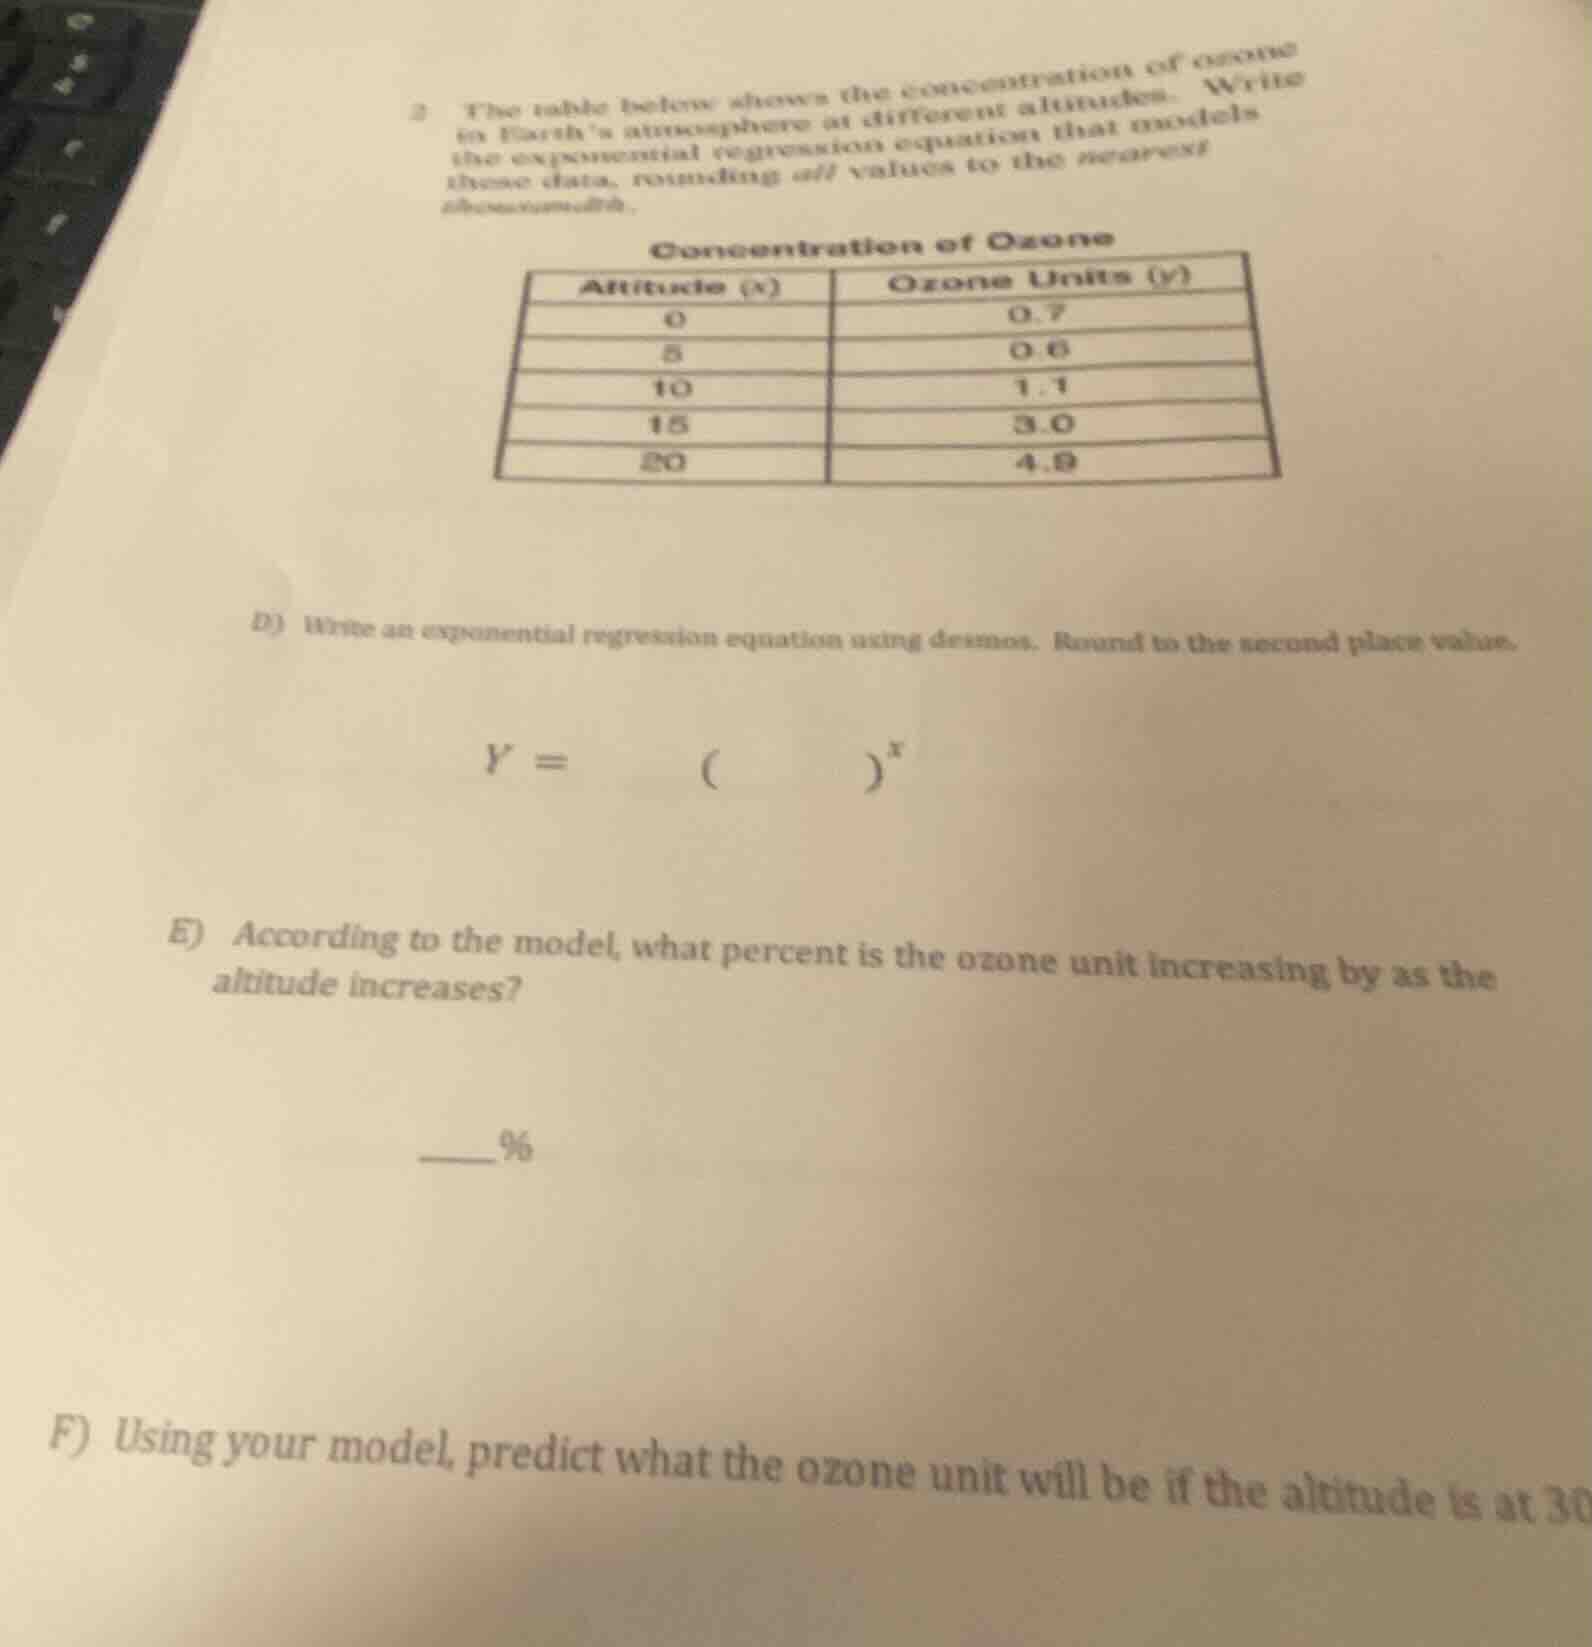
2 the table below shows the concentration of ozone in earths atmosphere at different altitudes. write the exponential regression equation that models these data, rounding off values to the nearest thousandth. concentration of ozone altitude (x) ozone units (y) 0 0.7 5 0.6 10 1.1 15 3.0 20 4.9 d) write an exponential regression equation using desmos. round to the second place value. y = ( )^x e) according to the model, what percent is the ozone unit increasing by as the altitude increases? ____% f) using your model, predict what the ozone unit will be if the altitude is at 30
Step1: Obtener ecuación de regresión
Usamos los datos $(x,y)$: $(0,0.7)$, $(5,0.6)$, $(10,1.1)$, $(15,3.0)$, $(20,4.9)$ en Desmos para calcular la regresión exponencial de la forma $y = ab^x$. Los valores redondeados a dos decimales son $a=0.70$ y $b=1.12$.
$$y = 0.70(1.12)^x$$
Step2: Calcular porcentaje de aumento
El factor de crecimiento es $b=1.12$. El porcentaje de aumento se obtiene restando 1 y multiplicando por 100.
$$(1.12 - 1) \times 100 = 12\%$$
Step3: Predecer ozono a 30 km
Sustituimos $x=30$ en la ecuación de regresión.
$$y = 0.70(1.12)^{30}$$
Calculamos $(1.12)^{30} \approx 29.96$, luego:
$$y = 0.70 \times 29.96 \approx 20.97$$

Snap & solve any problem in the app
Get step-by-step solutions on Sovi AI
Photo-based solutions with guided steps
Explore more problems and detailed explanations
D) $y = 0.70(1.12)^x$
E) 12%
F) 21.0 (o 20.97, redondeado a un decimal)