QUESTION IMAGE
Question
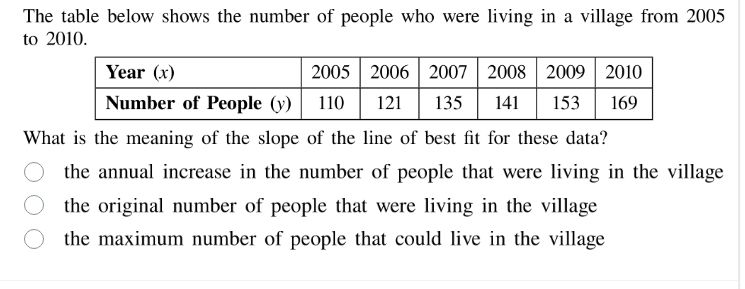
the table below shows the number of people who were living in a village from 2005 to 2010.
| year (x) | 2005 | 2006 | 2007 | 2008 | 2009 | 2010 |
|---|
what is the meaning of the slope of the line of best fit for these data?
- the annual increase in the number of people that were living in the village
- the original number of people that were living in the village
- the maximum number of people that could live in the village
In a linear model for time-series data where the independent variable is year ($x$) and the dependent variable is population ($y$), the slope represents the average rate of change of $y$ per unit change in $x$. Here, each unit of $x$ is one year, so the slope is the average annual increase in the village's population. The original population would be the y-intercept, and the maximum possible population is not related to the slope of this trend line.

Snap & solve any problem in the app
Get step-by-step solutions on Sovi AI
Photo-based solutions with guided steps
Explore more problems and detailed explanations
the annual increase in the number of people that were living in the village