QUESTION IMAGE
Question
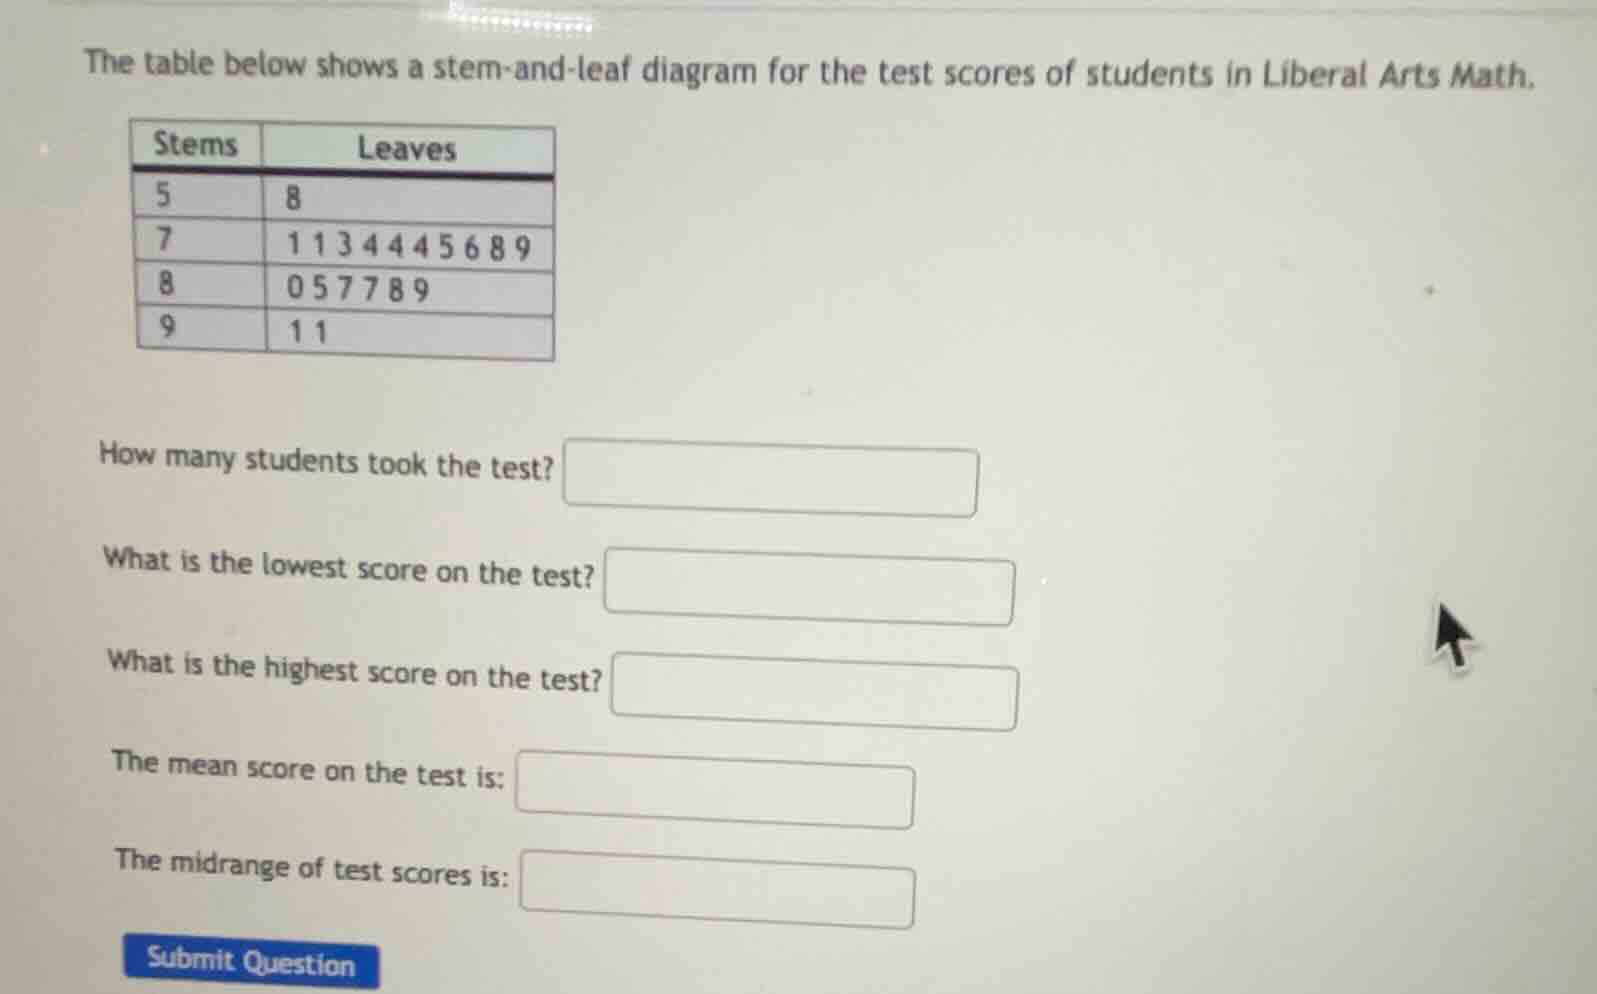
the table below shows a stem - and - leaf diagram for the test scores of students in liberal arts math.
stems leaves
5 8
7 1 1 3 4 4 4 5 6 8 9
8 0 5 7 7 8 9
9 1 1
how many students took the test?
what is the lowest score on the test?
what is the highest score on the test?
the mean score on the test is:
the midrange of test scores is:
1. Number of students who took the test
Step1: Count leaves for each stem
- Stem 5: 1 leaf (8)
- Stem 7: 10 leaves (1,1,3,4,4,4,5,6,8,9)
- Stem 8: 6 leaves (0,5,7,7,8,9)
- Stem 9: 2 leaves (1,1)
Step2: Sum the counts
$1 + 10 + 6 + 2 = 19$
The stem - leaf diagram represents scores as stem (tens place) and leaf (units place). The smallest stem is 5, and its leaf is 8. So the score is $5\times10 + 8 = 58$.
The largest stem is 9, and its leaf is 1. So the score is $9\times10+1 = 91$ (both leaves for stem 9 are 1, so the highest score from stem 9 is 91).

Snap & solve any problem in the app
Get step-by-step solutions on Sovi AI
Photo-based solutions with guided steps
Explore more problems and detailed explanations
19