QUESTION IMAGE
Question
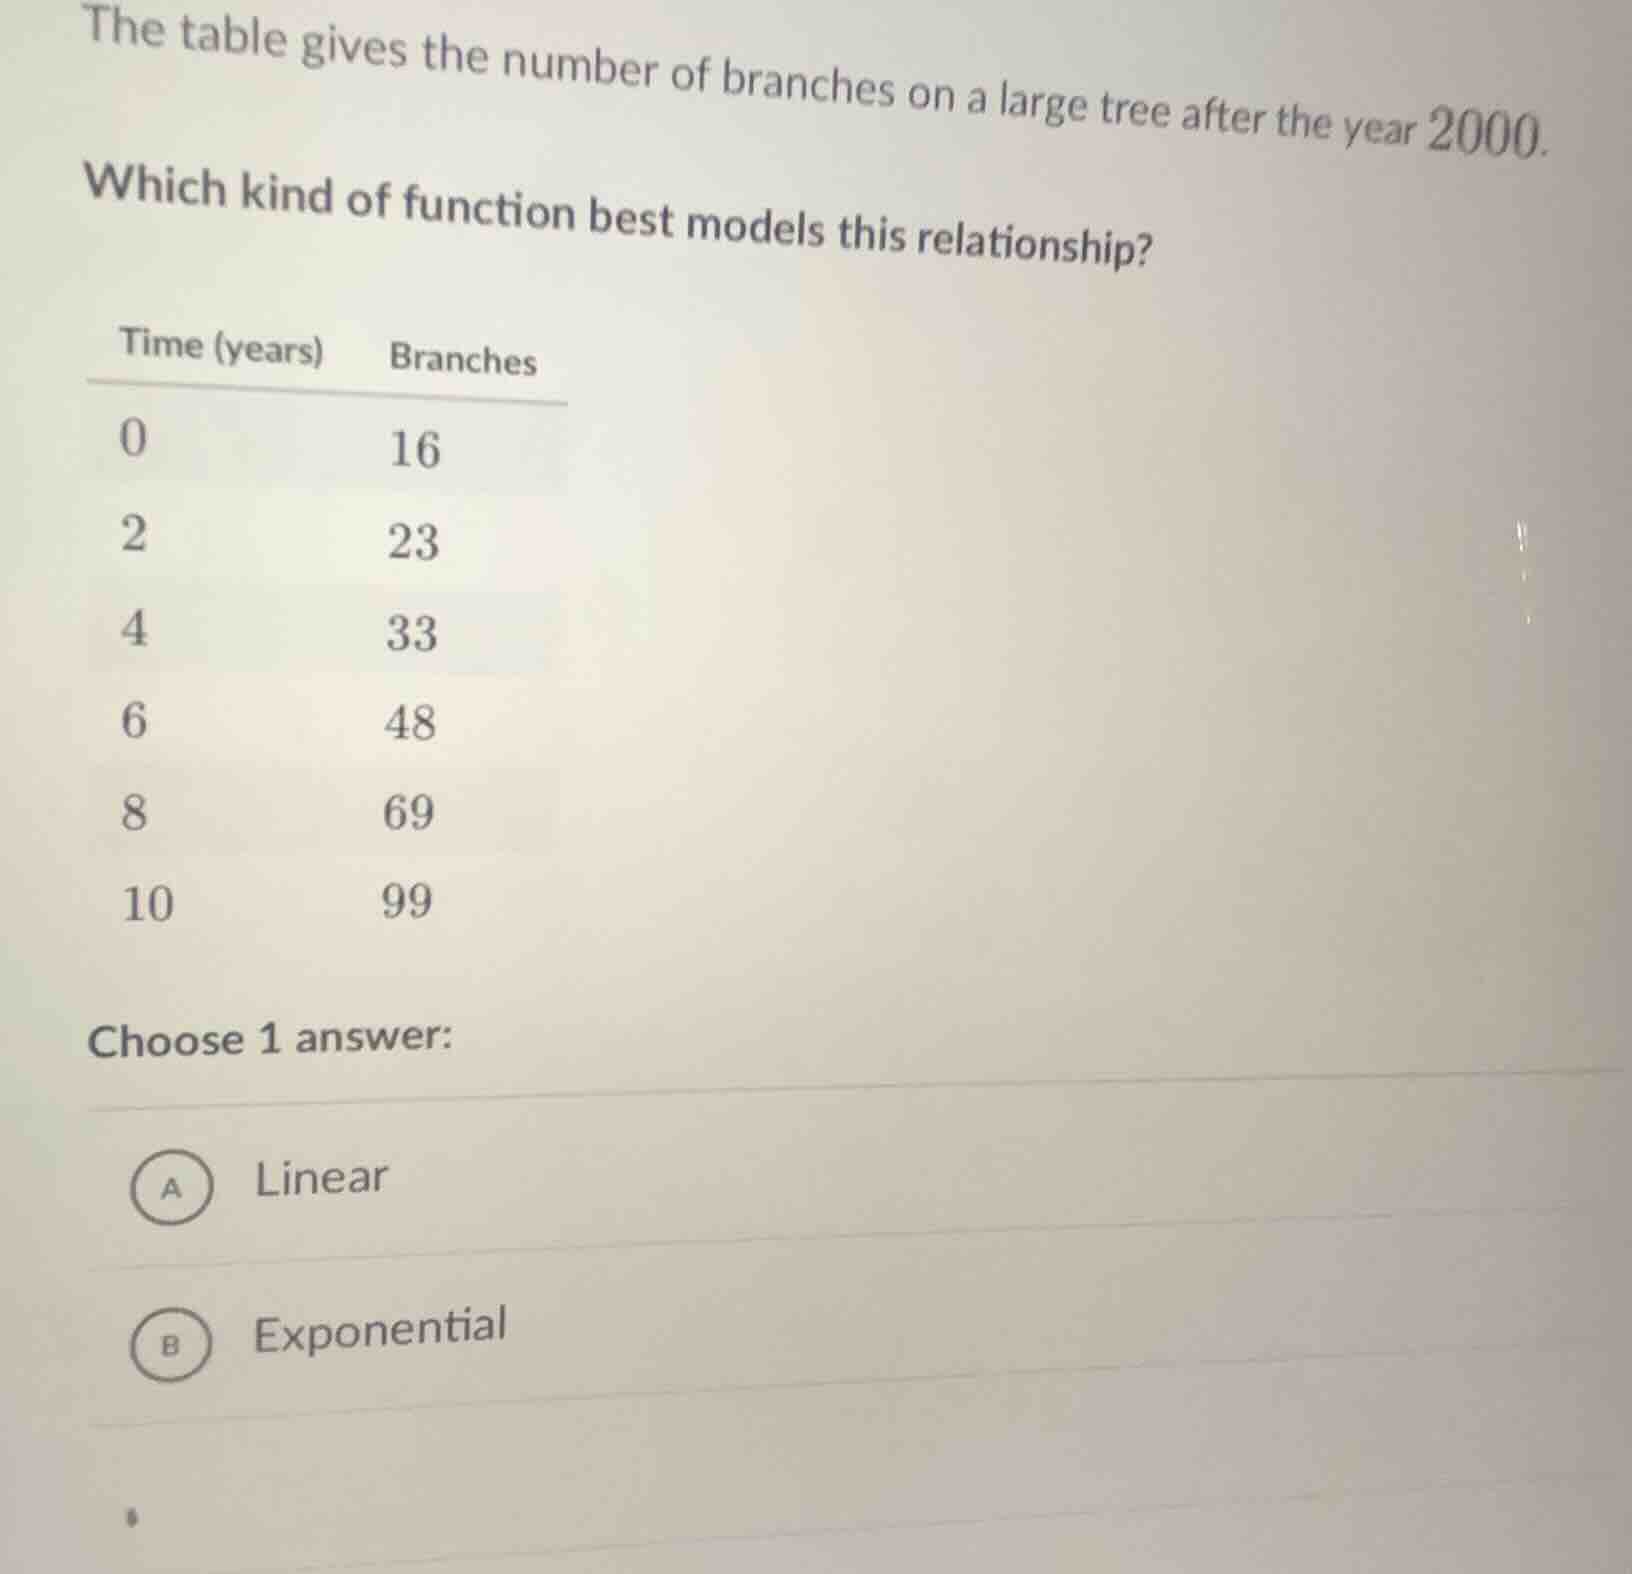
the table gives the number of branches on a large tree after the year 2000. which kind of function best models this relationship?
time (years) \tbranches
0 \t16
2 \t23
4 \t33
6 \t48
8 \t69
10 \t99
choose 1 answer:
a linear
b exponential
Step1: Check linear model (constant difference)
Calculate differences between consecutive branch counts:
$23-16=7$, $33-23=10$, $48-33=15$, $69-48=21$, $99-69=30$
Step2: Check exponential model (constant ratio)
Calculate ratios between consecutive branch counts:
$\frac{23}{16}=1.4375$, $\frac{33}{23}\approx1.4348$, $\frac{48}{33}\approx1.4545$, $\frac{69}{48}=1.4375$, $\frac{99}{69}\approx1.4348$
Step3: Compare consistency
Differences increase, ratios stay nearly constant.

Snap & solve any problem in the app
Get step-by-step solutions on Sovi AI
Photo-based solutions with guided steps
Explore more problems and detailed explanations
B. Exponential