QUESTION IMAGE
Question
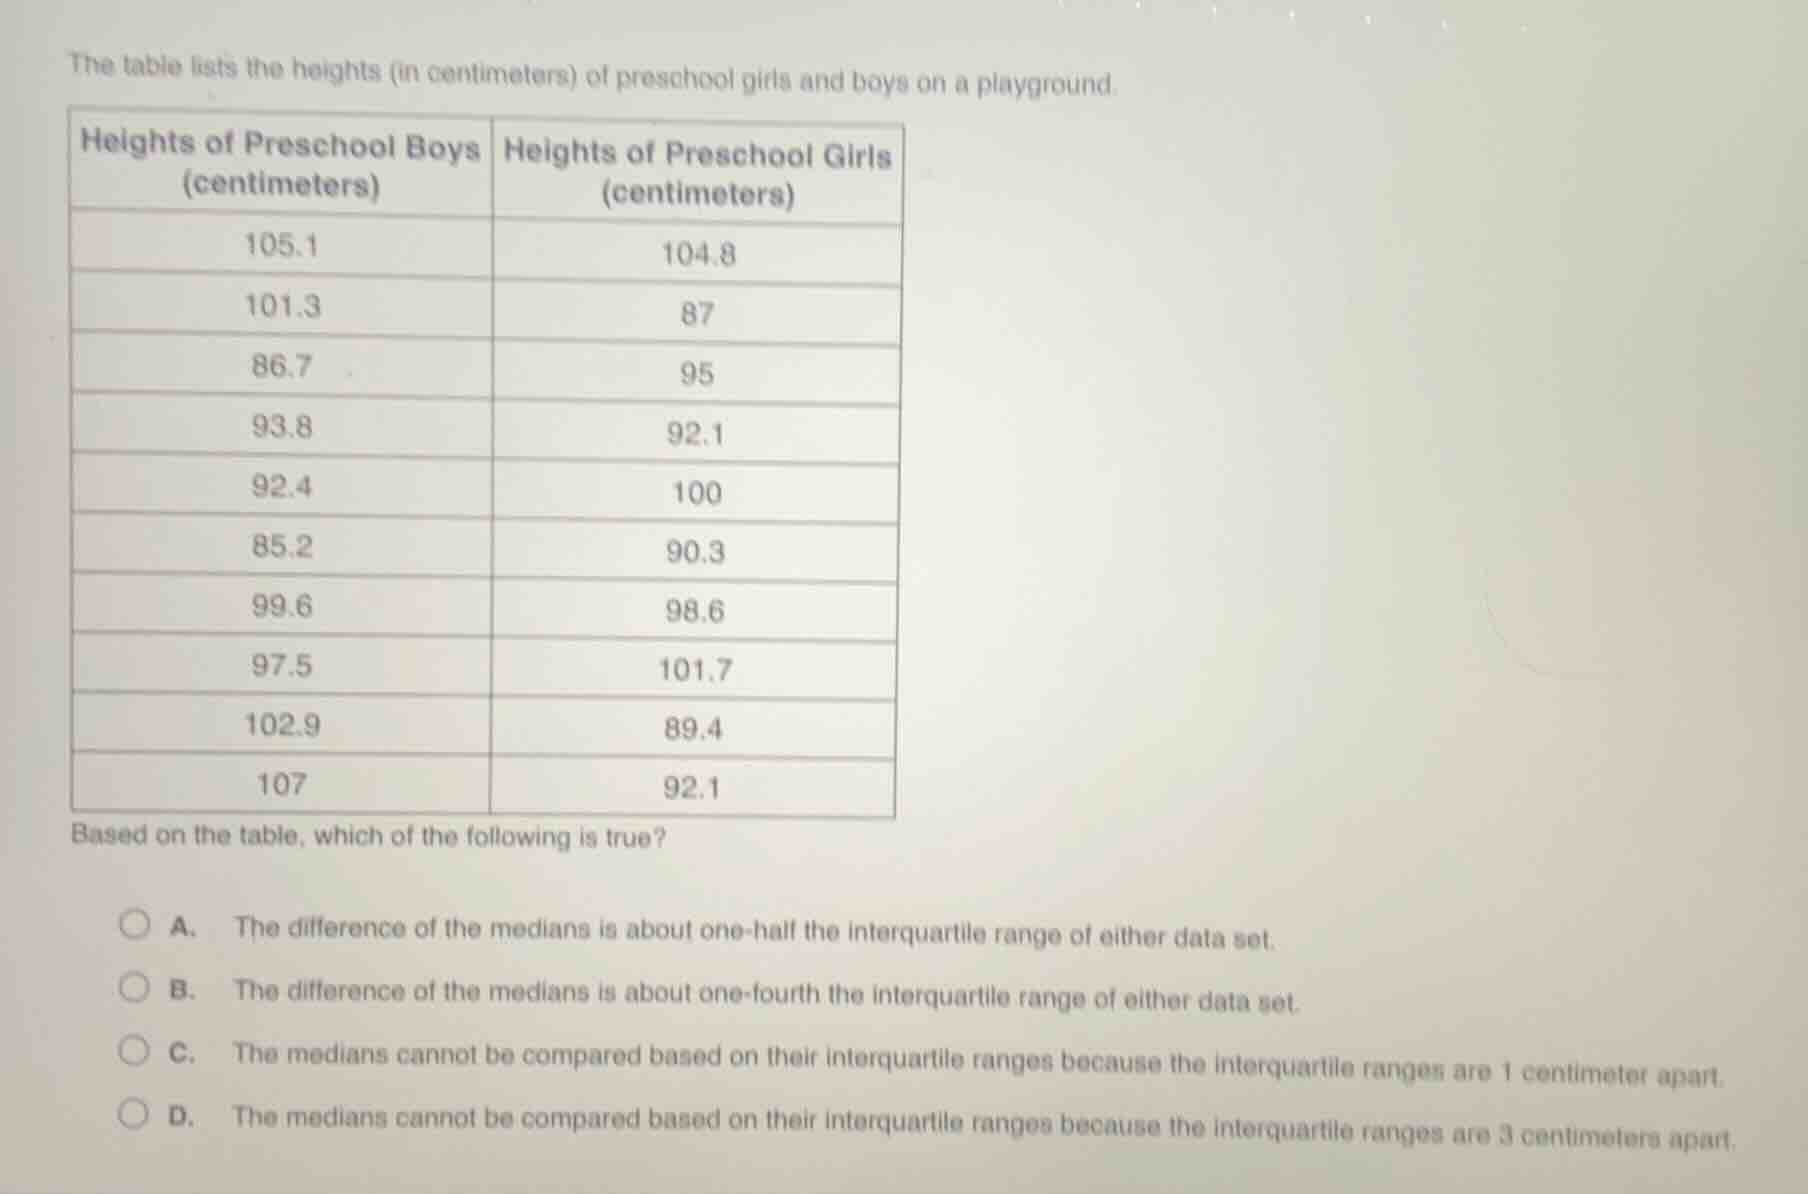
the table lists the heights (in centimeters) of preschool girls and boys on a playground.
heights of preschool boys (centimeters) | heights of preschool girls (centimeters)
105.1 | 104.8
101.3 | 87
86.7 | 95
93.8 | 92.1
92.4 | 100
85.2 | 90.3
99.6 | 98.6
97.5 | 101.7
102.9 | 89.4
107 | 92.1
based on the table, which of the following is true?
a. the difference of the medians is about one - half the interquartile range of either data set.
b. the difference of the medians is about one - fourth the interquartile range of either data set.
c. the medians cannot be compared based on their interquartile ranges because the interquartile ranges are 1 centimeter apart.
d. the medians cannot be compared based on their interquartile ranges because the interquartile ranges are 3 centimeters apart.
Step1: Organize the data for boys and girls
First, we need to sort the data for preschool boys and preschool girls.
For Preschool Boys (heights in cm): \( 85.2, 86.7, 92.4, 93.8, 97.5, 99.6, 101.3, 102.9, 105.1, 107 \) Wait, wait, actually, let's count the number of data points. Wait, the table has 10 entries for boys? Wait, no, let's check the table again. Wait, the first column: 105.1, 101.3, 86.7, 93.8, 92.4, 85.2, 99.6, 97.5, 102.9, 107. Wait, that's 10 data points? Wait, no, let's count: 105.1 (1), 101.3 (2), 86.7 (3), 93.8 (4), 92.4 (5), 85.2 (6), 99.6 (7), 97.5 (8), 102.9 (9), 107 (10). Wait, no, maybe I miscounted. Wait, the table for boys: let's list all the values:
Boys: 105.1, 101.3, 86.7, 93.8, 92.4, 85.2, 99.6, 97.5, 102.9, 107. Wait, that's 10 values? Wait, no, maybe I made a mistake. Wait, the original table: let's check the number of rows. The table has 10 rows (from 105.1 to 107 for boys, and same for girls). Wait, no, let's count the rows:
Row 1: 105.1 (boys), 104.8 (girls)
Row 2: 101.3, 87
Row 3: 86.7, 95
Row 4: 93.8, 92.1
Row 5: 92.4, 100
Row 6: 85.2, 90.3
Row 7: 99.6, 98.6
Row 8: 97.5, 101.7
Row 9: 102.9, 89.4
Row 10: 107, 92.1
So both boys and girls have 10 data points (n = 10).
Step2: Find the median for boys and girls
For a data set with n = 10 (even number), the median is the average of the 5th and 6th values when sorted.
First, sort the boys' data:
Boys' heights: 85.2, 86.7, 92.4, 93.8, 97.5, 99.6, 101.3, 102.9, 105.1, 107. Wait, no, wait, let's sort them in ascending order:
85.2, 86.7, 92.4, 93.8, 97.5, 99.6, 101.3, 102.9, 105.1, 107. Wait, 85.2 (1), 86.7 (2), 92.4 (3), 93.8 (4), 97.5 (5), 99.6 (6), 101.3 (7), 102.9 (8), 105.1 (9), 107 (10). So the 5th value is 97.5, 6th is 99.6. So median for boys: \( \frac{97.5 + 99.6}{2} = \frac{197.1}{2} = 98.55 \) cm.
Now girls' heights: let's sort them:
87, 89.4, 90.3, 92.1, 92.1, 95, 98.6, 100, 101.7, 104.8. Wait, let's list all girls' heights: 104.8, 87, 95, 92.1, 100, 90.3, 98.6, 101.7, 89.4, 92.1. Now sort them in ascending order:
87, 89.4, 90.3, 92.1, 92.1, 95, 98.6, 100, 101.7, 104.8.
So 10 data points, median is average of 5th and 6th values. 5th value: 92.1, 6th value: 95. So median for girls: \( \frac{92.1 + 95}{2} = \frac{187.1}{2} = 93.55 \) cm. Wait, no, wait, 5th and 6th: positions 5 and 6 (since n=10, positions 1-10). So sorted girls' data:
1: 87
2: 89.4
3: 90.3
4: 92.1
5: 92.1
6: 95
7: 98.6
8: 100
9: 101.7
10: 104.8
So 5th value: 92.1, 6th: 95. So median_girls = (92.1 + 95)/2 = 93.55? Wait, no, wait, 92.1 + 95 = 187.1, divided by 2 is 93.55. Wait, but boys' median was 98.55. So the difference in medians: 98.55 - 93.55 = 5 cm.
Step3: Find the Interquartile Range (IQR) for boys and girls
IQR is Q3 - Q1, where Q1 is the median of the lower half, Q3 is the median of the upper half.
For boys (n=10), the lower half is the first 5 data points: 85.2, 86.7, 92.4, 93.8, 97.5. The median of the lower half (Q1) is the 3rd value (since n=5, odd), so Q1_boys = 92.4.
The upper half is the last 5 data points: 99.6, 101.3, 102.9, 105.1, 107. The median of the upper half (Q3) is the 3rd value, so Q3_boys = 102.9.
Thus, IQR_boys = Q3 - Q1 = 102.9 - 92.4 = 10.5 cm.
For girls (n=10), lower half: first 5 data points: 87, 89.4, 90.3, 92.1, 92.1. Median of lower half (Q1) is 3rd value: 90.3.
Upper half: last 5 data points: 95, 98.6, 100, 101.7, 104.8. Median of upper half (Q3) is 3rd value: 100.
Thus, IQR_girls = Q3 - Q1 = 100 - 90.3 = 9.7 cm (approximately 10 cm, or 9.7, close to 10).
Wait, but let's check again. Wait, for girl…

Snap & solve any problem in the app
Get step-by-step solutions on Sovi AI
Photo-based solutions with guided steps
Explore more problems and detailed explanations
A. The difference of the medians is about one-half the interquartile range of either data set.