QUESTION IMAGE
Question
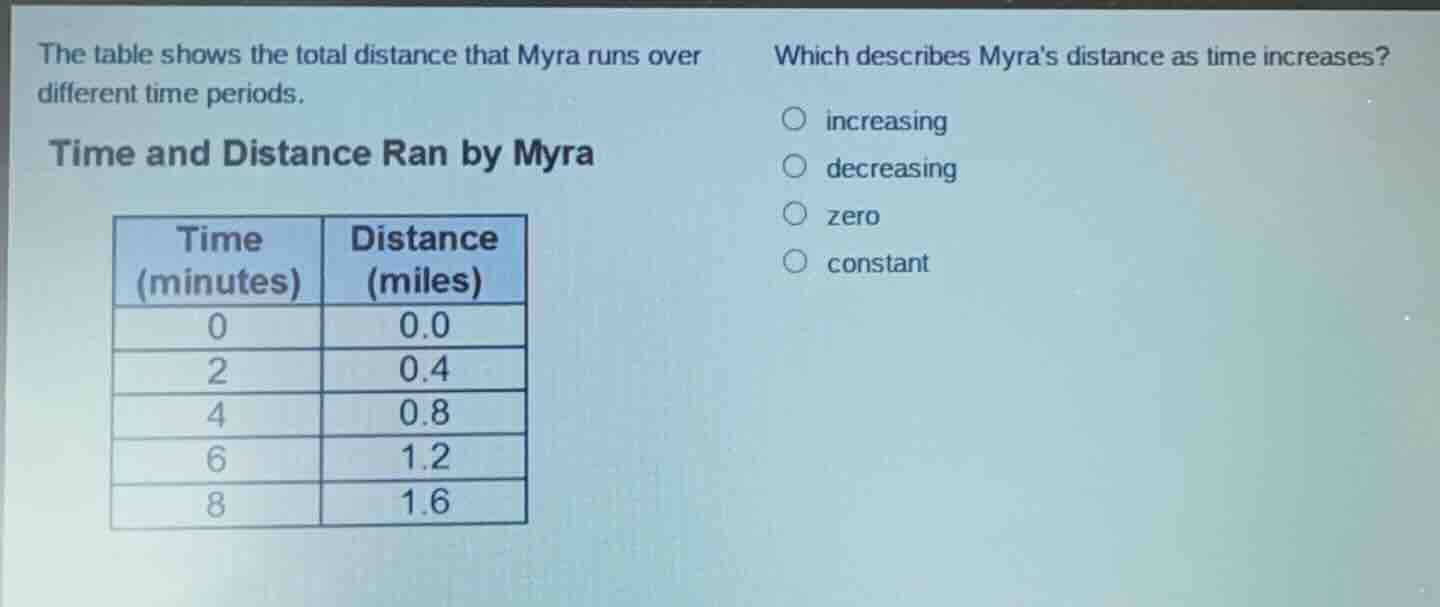
the table shows the total distance that myra runs over different time periods.
time and distance ran by myra
which describes myras distance as time increases?
○ increasing
○ decreasing
○ zero
○ constant
Step1: Observe time values
Time: $0, 2, 4, 6, 8$ (increasing)
Step2: Observe distance values
Distance: $0.0, 0.4, 0.8, 1.2, 1.6$ (increasing)
Step3: Compare trends
As time rises, distance rises.

Snap & solve any problem in the app
Get step-by-step solutions on Sovi AI
Photo-based solutions with guided steps
Explore more problems and detailed explanations
increasing