QUESTION IMAGE
Question
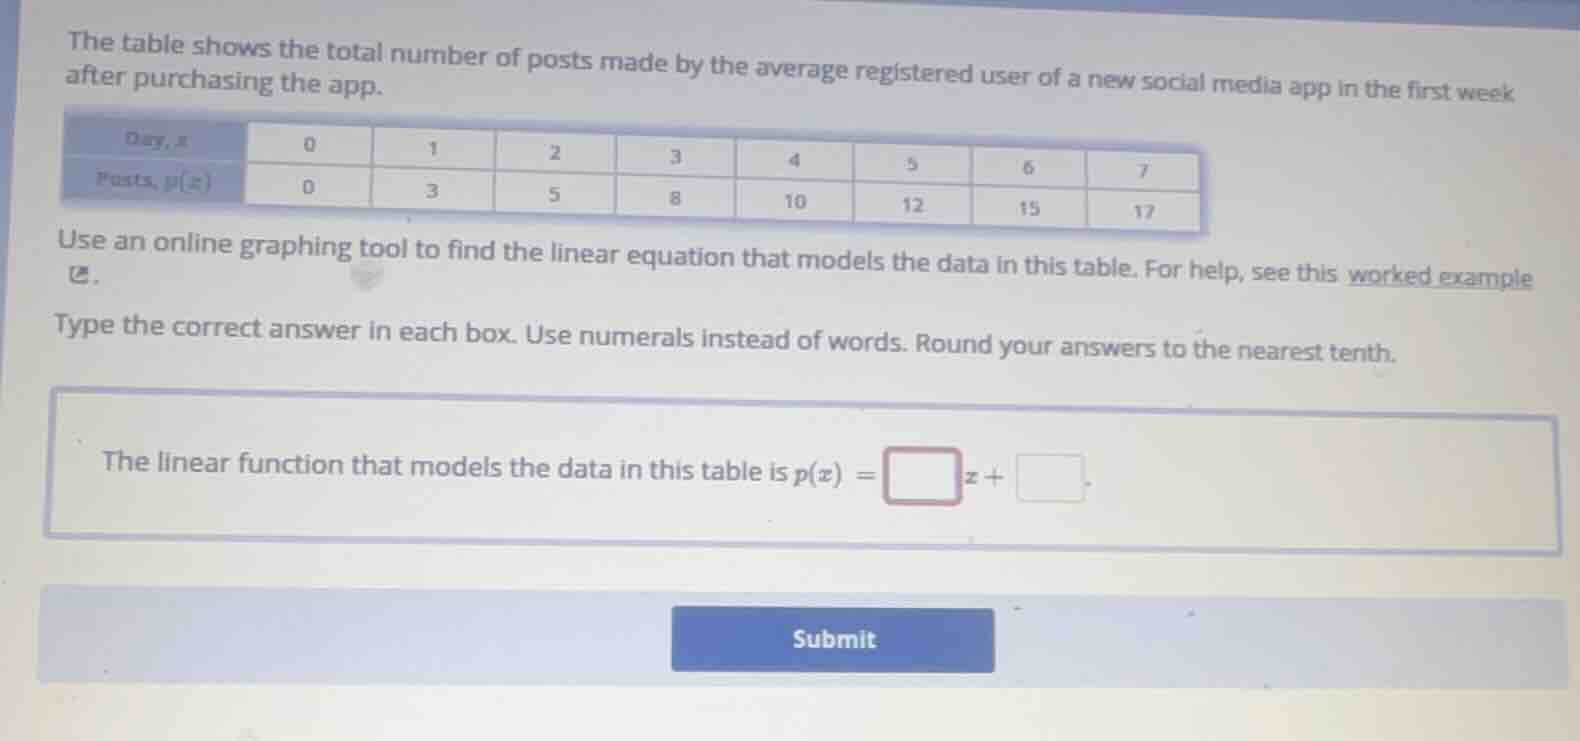
the table shows the total number of posts made by the average registered user of a new social media app in the first week after purchasing the app.
day, x | 0 | 1 | 2 | 3 | 4 | 5 | 6 | 7
posts, p(x) | 0 | 3 | 5 | 8 | 10 | 12 | 15 | 17
use an online graphing tool to find the linear equation that models the data in this table. for help, see this worked example
type the correct answer in each box. use numerals instead of words. round your answers to the nearest tenth.
the linear function that models the data in this table is p(x) = \square x + \square.
Step1: Identify data points
We have the points: $(0,0), (1,3), (2,5), (3,8), (4,10), (5,12), (6,15), (7,17)$
Step2: Calculate slope (m)
Use the formula for the slope of a linear regression:
$$m = \frac{n\sum(xy) - \sum x \sum y}{n\sum(x^2) - (\sum x)^2}$$
First, compute sums:
$\sum x = 0+1+2+3+4+5+6+7 = 28$
$\sum y = 0+3+5+8+10+12+15+17 = 70$
$\sum(xy) = (0*0)+(1*3)+(2*5)+(3*8)+(4*10)+(5*12)+(6*15)+(7*17) = 0+3+10+24+40+60+90+119 = 346$
$\sum(x^2) = 0^2+1^2+2^2+3^2+4^2+5^2+6^2+7^2 = 0+1+4+9+16+25+36+49 = 140$
$n=8$
Substitute into slope formula:
$$m = \frac{8*346 - 28*70}{8*140 - 28^2} = \frac{2768 - 1960}{1120 - 784} = \frac{808}{336} \approx 2.4$$
Step3: Calculate y-intercept (b)
Use $\bar{y} = m\bar{x} + b$, where $\bar{x} = \frac{\sum x}{n}$, $\bar{y} = \frac{\sum y}{n}$
$\bar{x} = \frac{28}{8} = 3.5$, $\bar{y} = \frac{70}{8} = 8.75$
$$b = 8.75 - 2.4*3.5 = 8.75 - 8.4 = 0.4$$

Snap & solve any problem in the app
Get step-by-step solutions on Sovi AI
Photo-based solutions with guided steps
Explore more problems and detailed explanations
The linear function that models the data in this table is $p(x) = 2.4x + 0.4$