QUESTION IMAGE
Question
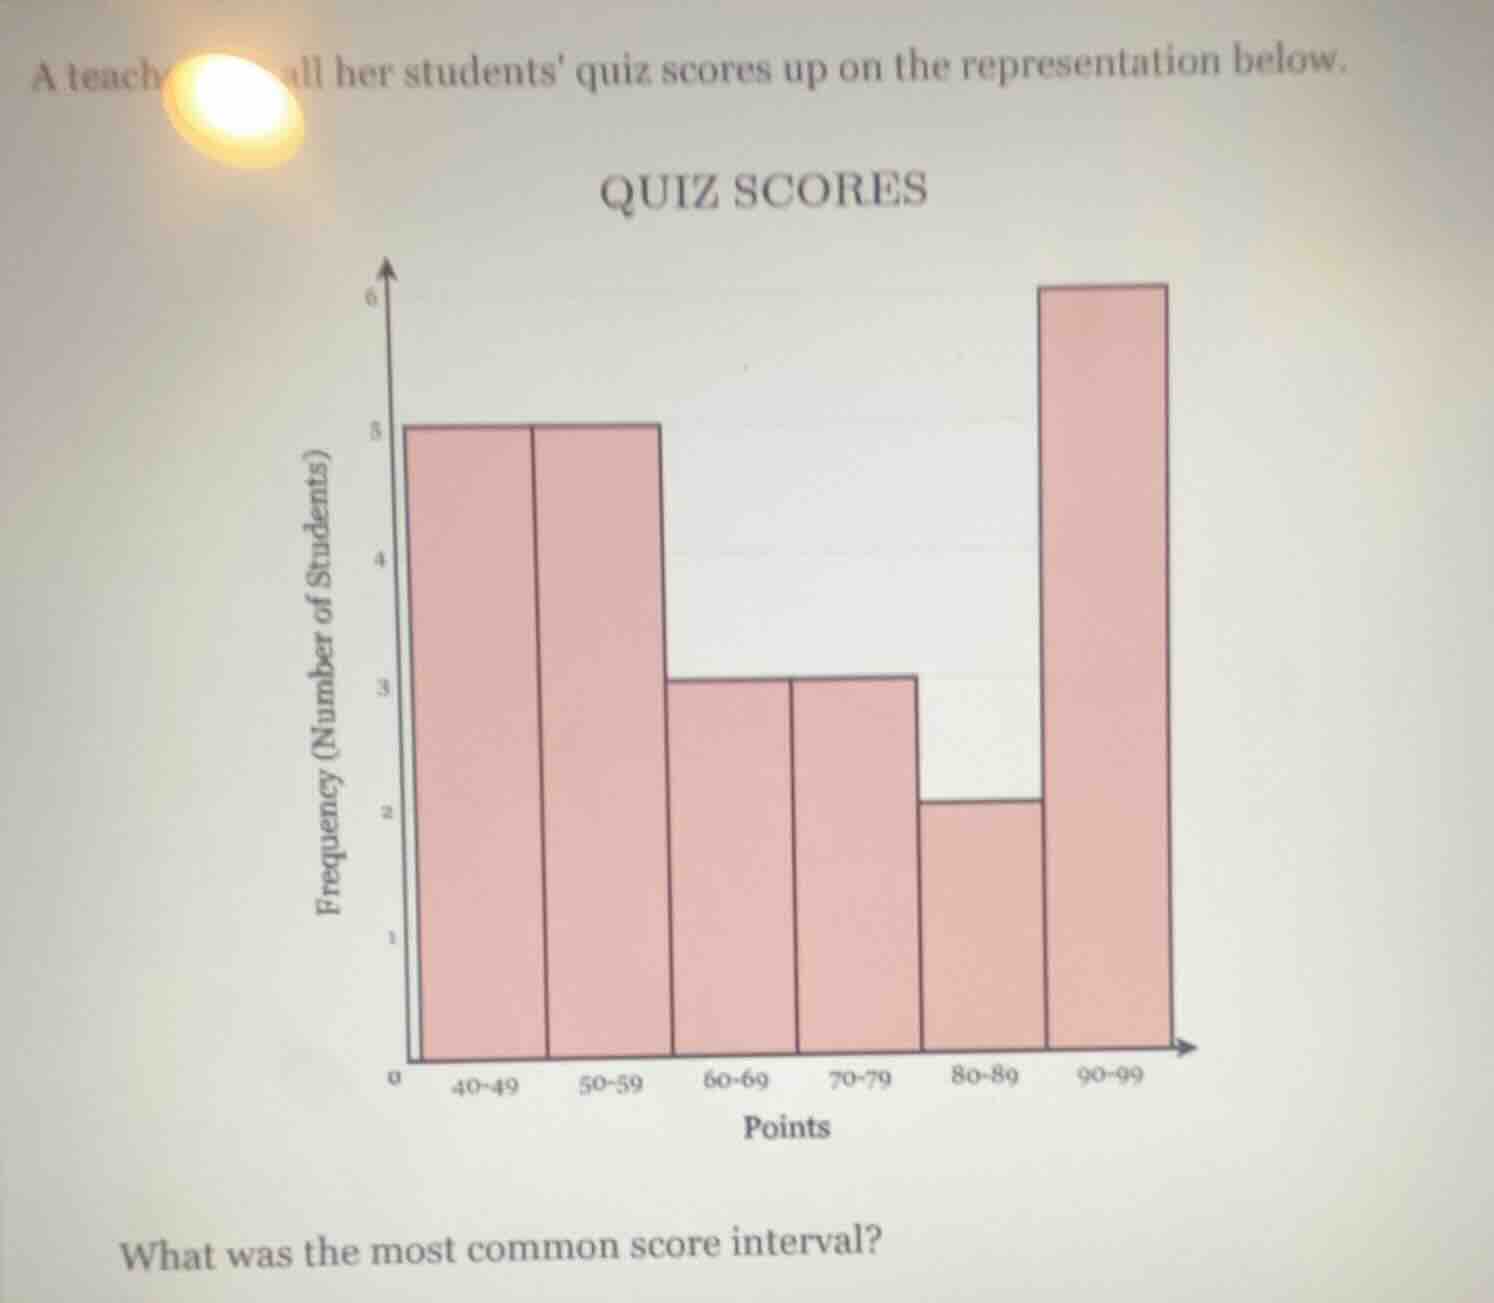
a teacher tall her students quiz scores up on the representation below.
quiz scores
(chart: x - axis: points (40 - 49, 50 - 59, 60 - 69, 70 - 79, 80 - 89, 90 - 99); y - axis: frequency (number of students), with bars: 40 - 49: 5, 50 - 59: 5, 60 - 69: 3, 70 - 79: 3, 80 - 89: 2, 90 - 99: 6)
what was the most common score interval?
Brief Explanations
The histogram shows the frequency of students in each quiz score interval. The interval with the tallest bar has the highest frequency, meaning it is the most common. The 90-99 interval has the tallest bar, with 6 students.

Snap & solve any problem in the app
Get step-by-step solutions on Sovi AI
Photo-based solutions with guided steps
Explore more problems and detailed explanations
90-99