QUESTION IMAGE
Question
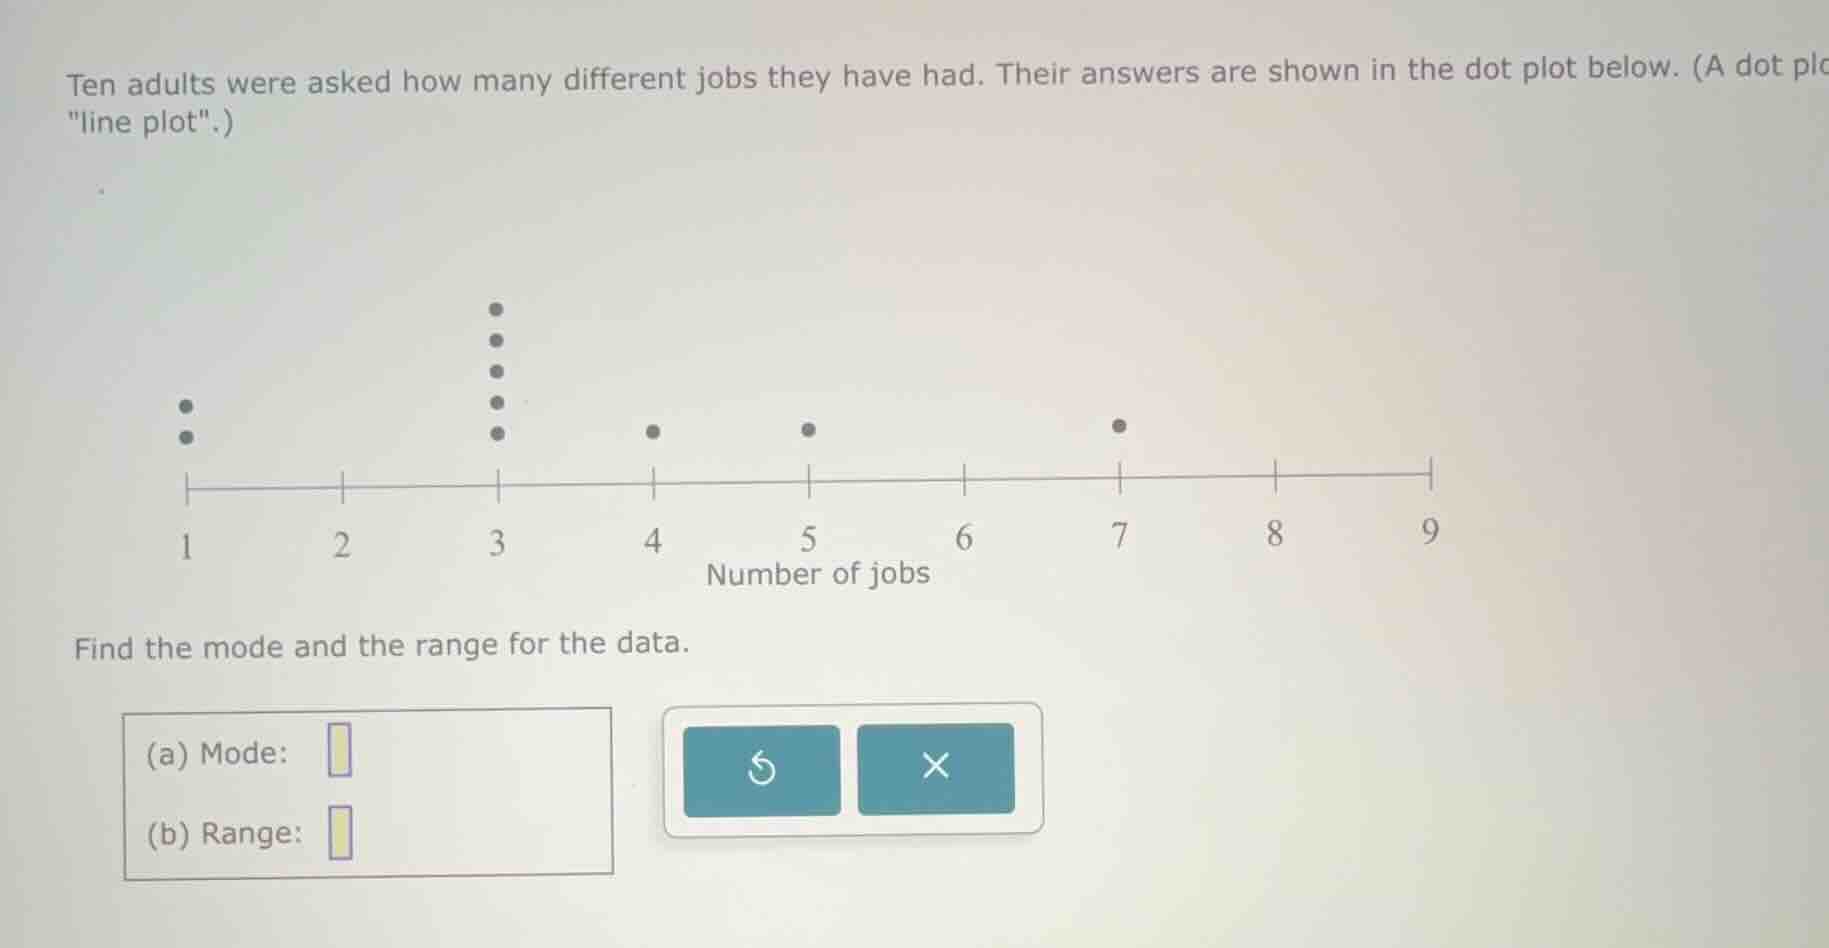
ten adults were asked how many different jobs they have had. their answers are shown in the dot plot below. (a dot pl\line plot\.)find the mode and the range for the data.(a) mode: (b) range:
Step1: Identify mode (most frequent value)
Count dots per value: 1 has 2, 3 has 5, 4 has1,5 has1,7 has1. The highest count is 5 at value 3.
Step2: Calculate range (max - min)
Max value = 7, Min value = 1.
$\text{Range} = 7 - 1$

Snap & solve any problem in the app
Get step-by-step solutions on Sovi AI
Photo-based solutions with guided steps
Explore more problems and detailed explanations
(a) Mode: 3
(b) Range: 6