QUESTION IMAGE
Question
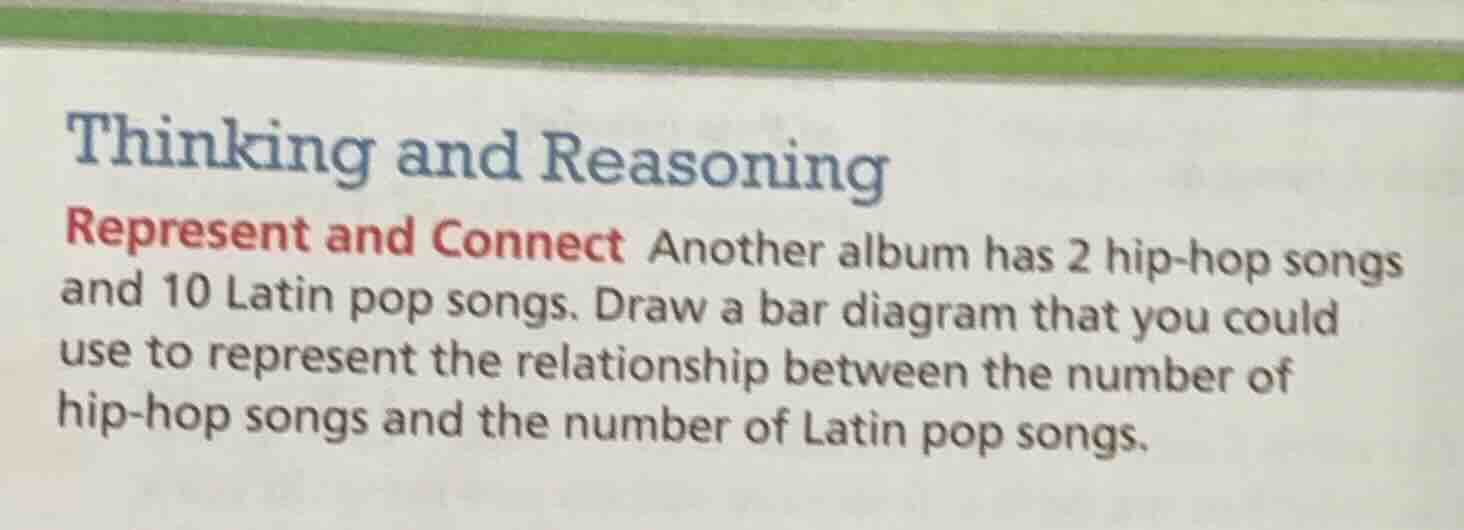
thinking and reasoning
represent and connect another album has 2 hip - hop songs and 10 latin pop songs. draw a bar diagram that you could use to represent the relationship between the number of hip - hop songs and the number of latin pop songs.
Step1: Determine the categories and values
We have two categories: hip - hop songs and Latin pop songs. The number of hip - hop songs is 2, and the number of Latin pop songs is 10.
Step2: Set up the bar diagram axes
On the horizontal axis (x - axis), we label the two categories: "Hip - hop Songs" and "Latin Pop Songs". On the vertical axis (y - axis), we set a scale. Since the maximum number of songs is 10, we can set the scale from 0 to 10 with an appropriate interval, for example, an interval of 1 or 2.
Step3: Draw the bars
For "Hip - hop Songs", we draw a bar that reaches up to the value 2 on the y - axis. For "Latin Pop Songs", we draw a bar that reaches up to the value 10 on the y - axis. The bars should be of equal width and there should be a gap between them (or they can be adjacent, depending on the style of the bar diagram) to clearly distinguish the two categories.
A simple way to represent this is:
| Song Type | Number of Songs |
|---|---|
| Latin Pop Songs | 10 |
To draw the bar graph:
- Draw a vertical axis (y - axis) and mark the numbers from 0 to 10 (since the maximum number of songs is 10).
- Draw a horizontal axis (x - axis) and mark two categories: "Hip - hop" and "Latin Pop".
- For "Hip - hop", draw a rectangle (bar) starting from the x - axis under the "Hip - hop" label, with a height corresponding to 2 on the y - axis.
- For "Latin Pop", draw a rectangle (bar) starting from the x - axis under the "Latin Pop" label, with a height corresponding to 10 on the y - axis.

Snap & solve any problem in the app
Get step-by-step solutions on Sovi AI
Photo-based solutions with guided steps
Explore more problems and detailed explanations
To draw the bar diagram:
- Axes Setup:
- Draw a vertical axis (y - axis) and label it "Number of Songs". Mark the axis with numbers from 0 to 10 (or a suitable range that includes 10).
- Draw a horizontal axis (x - axis) and label two categories: "Hip - hop Songs" and "Latin Pop Songs".
- Drawing Bars:
- For "Hip - hop Songs", draw a bar with a height corresponding to the value 2 on the y - axis.
- For "Latin Pop Songs", draw a bar with a height corresponding to the value 10 on the y - axis. The bars should be of equal width and can be either adjacent or separated by a small gap for clarity.
(Note: Since this is a text - based description, a visual representation would have two bars, one shorter (for hip - hop, height 2) and one much taller (for Latin pop, height 10), on a graph with the x - axis labels as the song types and y - axis as the number of songs.)