QUESTION IMAGE
Question
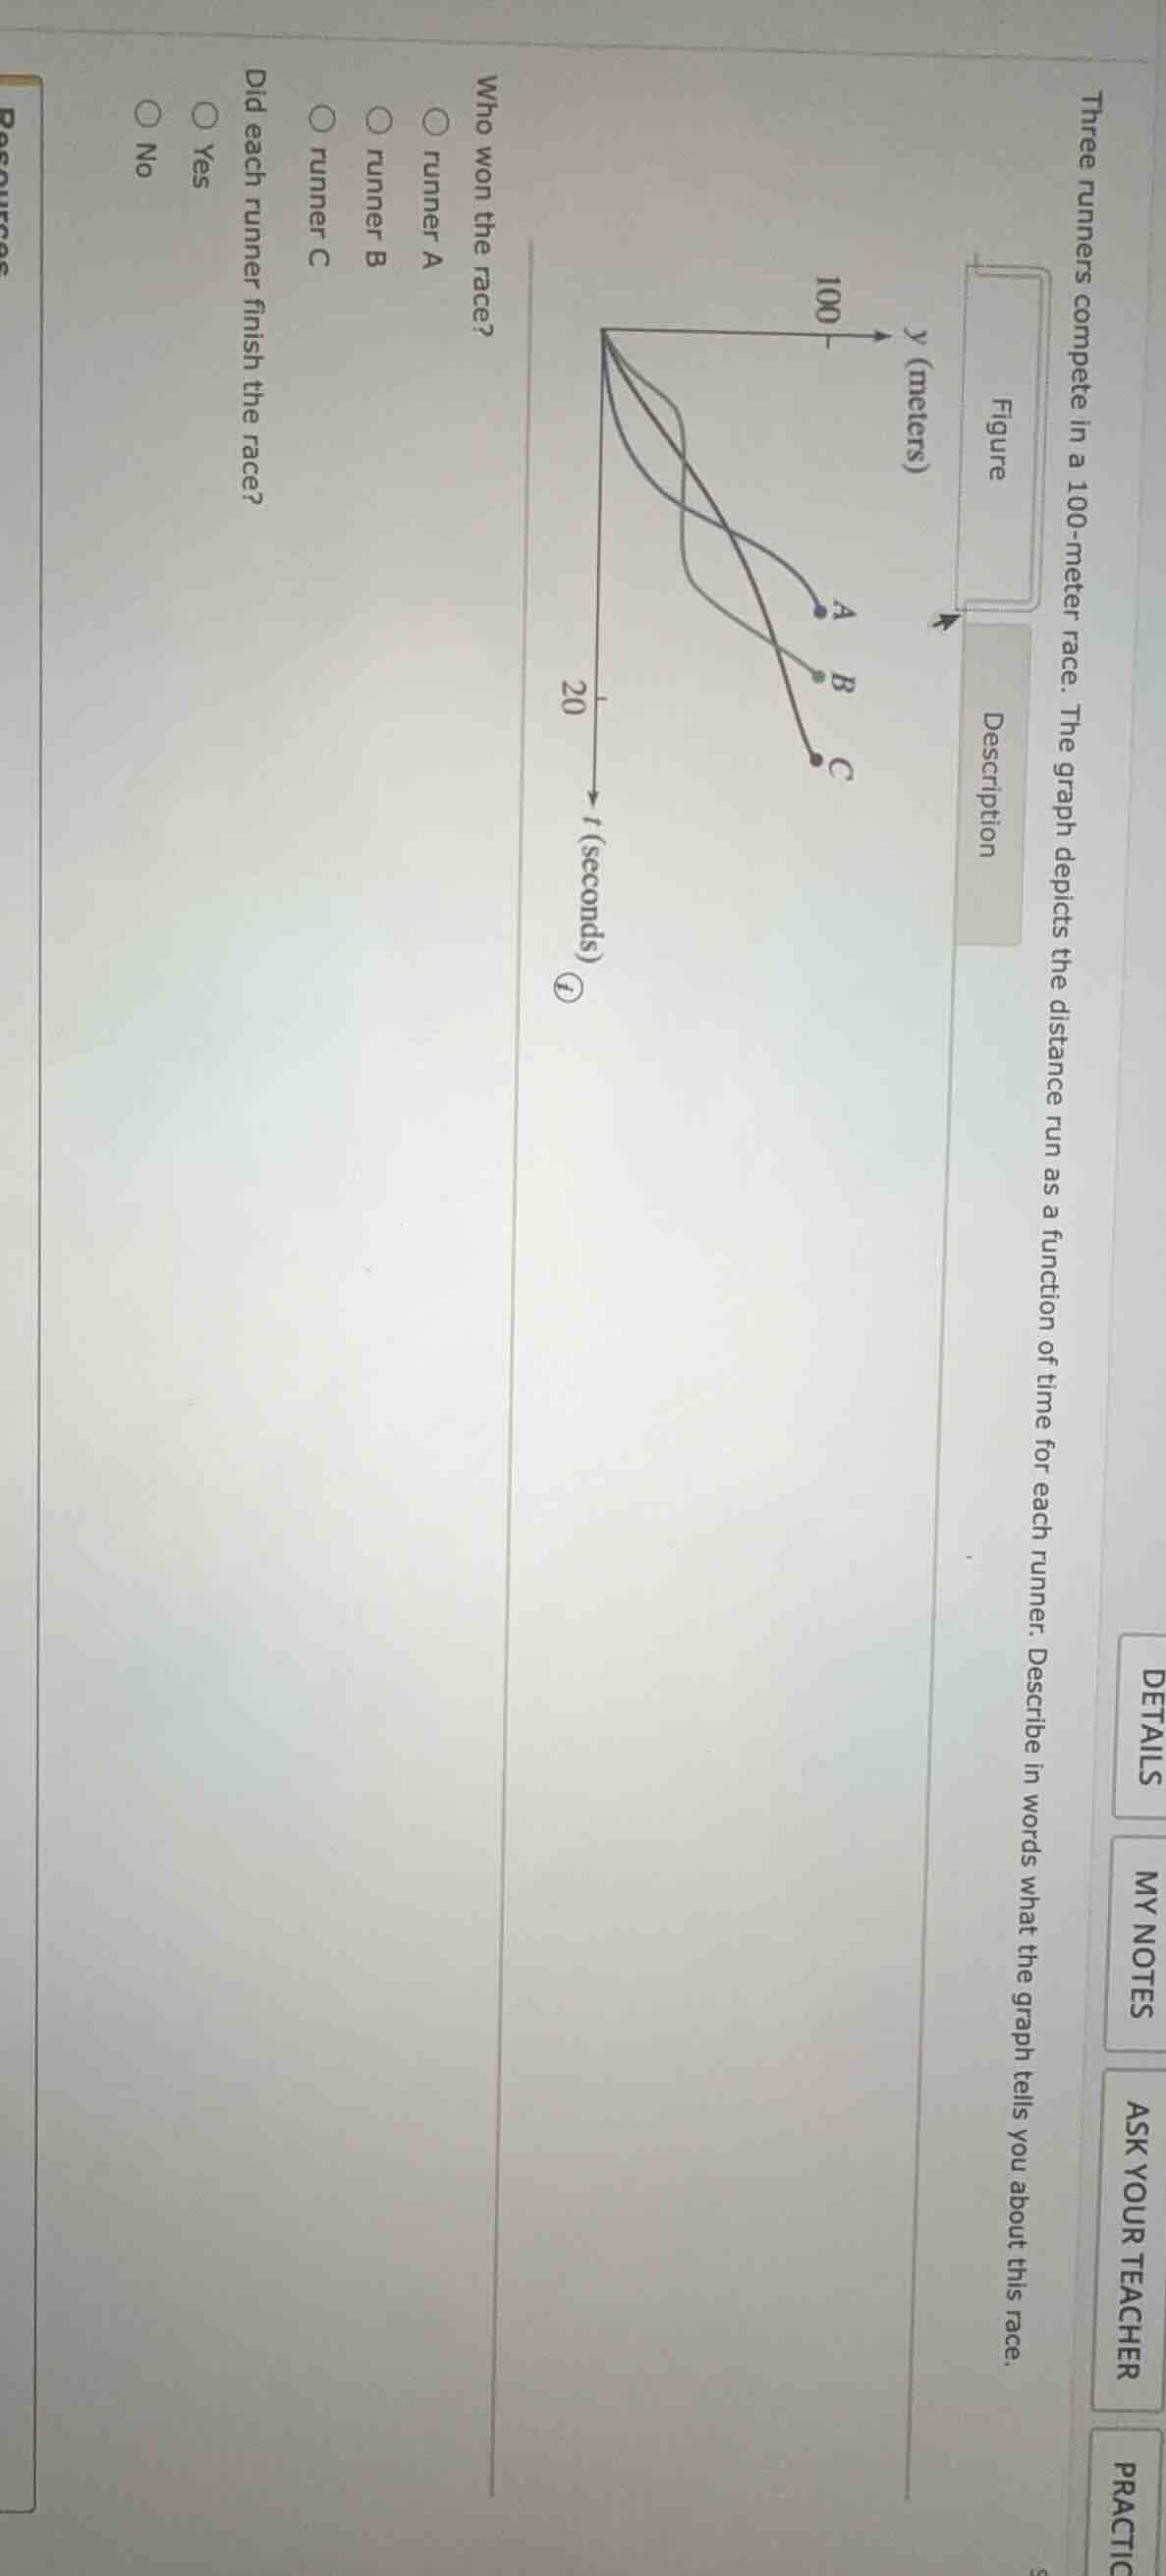
three runners compete in a 100 - meter race. the graph depicts the distance run as a function of time for each runner. describe in words what the graph tells you about this race. who won the race?
○ runner a
○ runner b
○ runner c
did each runner finish the race?
○ yes
○ no
Brief Explanations
- For the race winner: On a distance-time graph, the runner who reaches 100 meters (the maximum y-value) in the least time (smallest t-value) wins. Runner A's endpoint has the smallest t-value among all runners at y=100 meters.
- For finishing the race: All three runners' graphs end at y=100 meters, meaning each completed the 100-meter distance.

Snap & solve any problem in the app
Get step-by-step solutions on Sovi AI
Photo-based solutions with guided steps
Explore more problems and detailed explanations
Who won the race?
runner A
Did each runner finish the race?
Yes