QUESTION IMAGE
Question
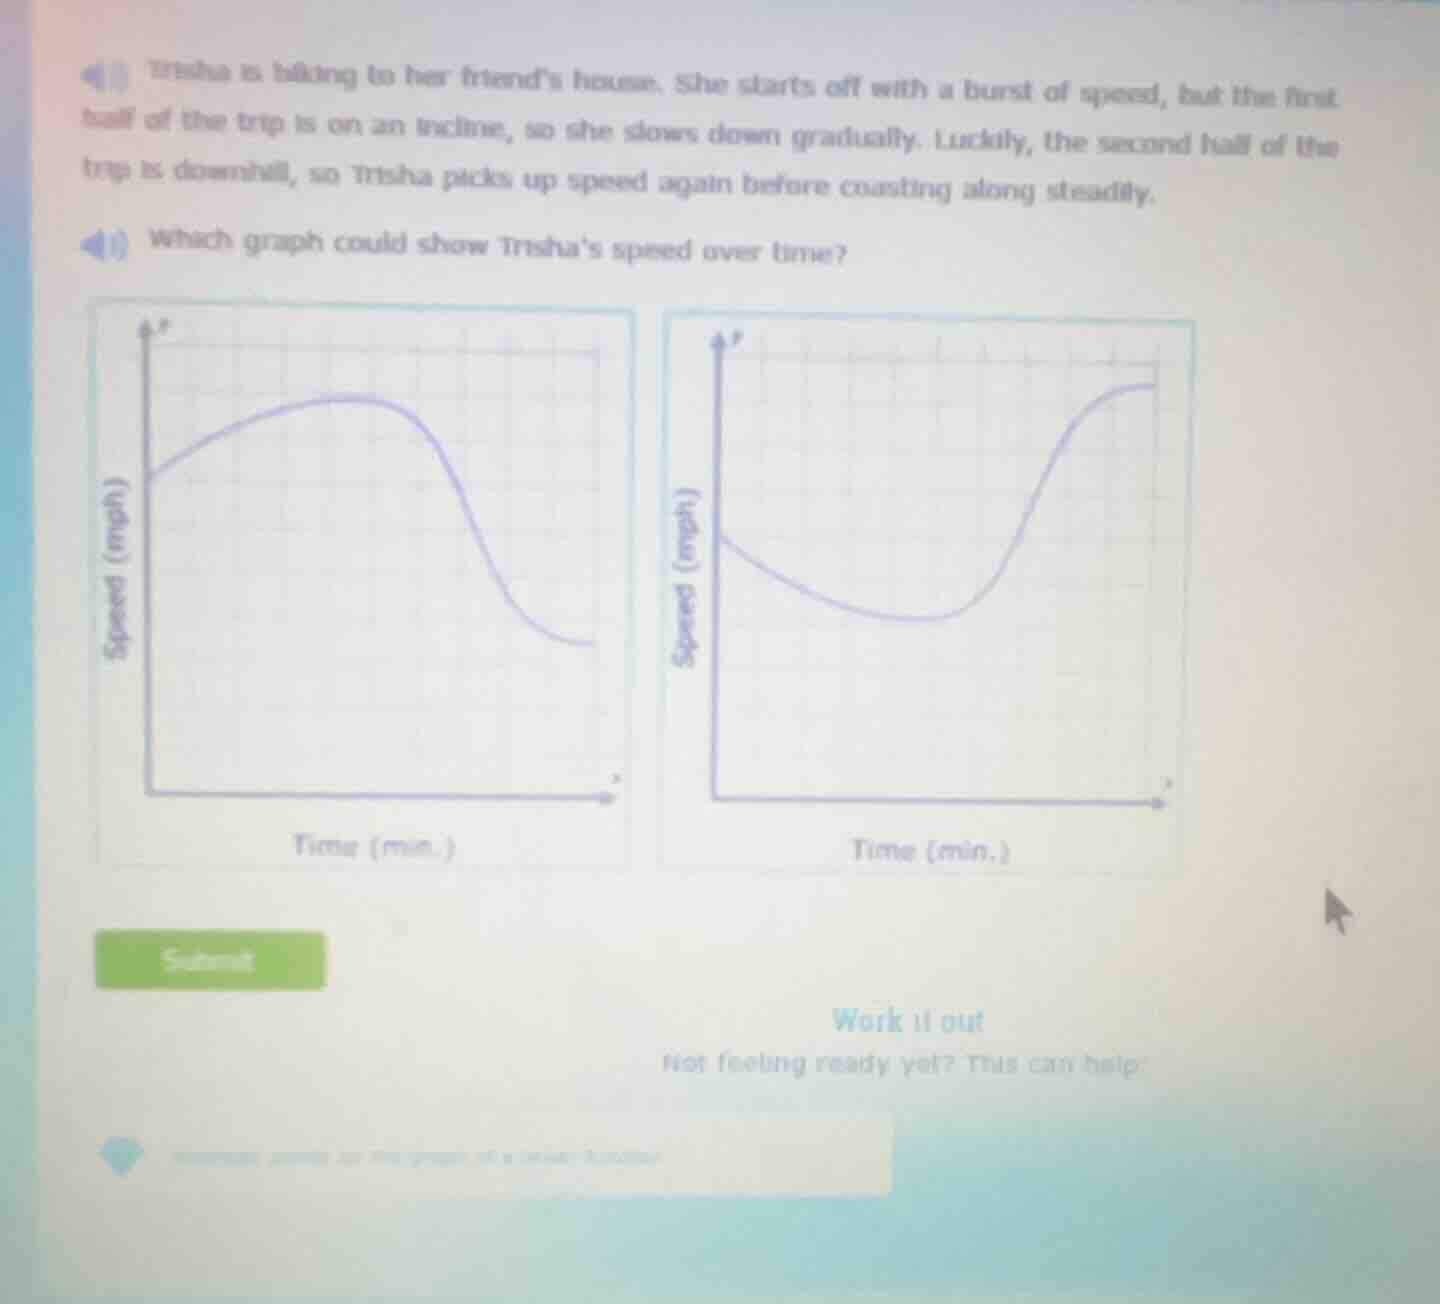
trisha is hiking to her friend’s house. she starts off with a burst of speed, but the first half of the trip is on an incline, so she slows down gradually. luckily, the second half of the trip is downhill, so trisha picks up speed again before coasting along steadily. which graph could show trisha’s speed over time?
Step1: Map speed changes to sequence
- Burst of speed (increase)
- Slow down gradually (decrease)
- Pick up speed (increase)
- Coast steadily (constant)
Step2: Match to graph options
- Left graph: Increase → Decrease (ends decreasing) → No final steady phase.
- Right graph: Decrease → Increase → Levels off (steady). Wait, correct sequence: Start burst (speed up) → slow down (uphill) → speed up (downhill) → steady. Wait, recheck: The right graph first decreases, but the problem says "starts off with a burst of speed" (initial increase), then slows (decrease) for first half, then speeds up (increase) then steady. Wait, re-express the full sequence:
- Initial speed burst: Speed rises from start
- Uphill first half: Speed gradually falls
- Downhill second half: Speed rises again
- Coast: Speed stays constant
Now match: Right graph: Starts at a speed, falls, then rises, then levels. Wait, no—wait, the "burst of speed" is the start, so initial speed goes up first. Wait, no, the left graph: starts, rises, then falls, keeps falling. No. Wait, re-read problem: "She starts off with a burst of speed, but the first half of the trip is on an incline, so she slows down gradually. Luckily, the second half of the trip is downhill, so Trisha picks up speed again before coasting along steadily."
Sequence:
- Start: Speed increases (burst)
- First half (uphill): Speed decreases gradually
- Second half (downhill): Speed increases
- End: Speed stays constant (coast)
Now check graphs:
Right graph: Starts at a speed, decreases, then increases, then levels. Wait, the "burst" would be an initial rise, but maybe the starting point is 0? No, the y-axis is speed (mph). Wait, maybe the "burst" is a quick initial increase to a speed, then slow down (uphill), then speed up, then steady. The right graph: after decreasing, it increases then levels. Wait, no—wait, the left graph increases, then decreases, keeps decreasing. The right graph: decreases, then increases, then levels. Wait, maybe I misread: "starts off with a burst of speed" (so speed goes up quickly from 0 to some value), then slows down (speed decreases) for uphill first half, then speeds up (speed increases) downhill, then coasts (speed constant). The right graph, if we adjust: maybe the initial "burst" is the first part? No, the right graph starts at a speed, then goes down. Wait, no—wait, the correct graph is the right one? No, wait: no, let's re-express each phase with time:
- Phase 1: 0 to t1: Speed increases (burst)
- Phase 2: t1 to t2 (first half trip): Speed decreases gradually
- Phase 3: t2 to t3 (second half start): Speed increases
- Phase 4: t3 to end: Speed constant
The right graph shows: speed decreases first, then increases, then constant. That doesn't match phase 1. Wait, left graph: speed increases, then decreases, keeps decreasing. No. Wait, maybe I misinterpret "starts off with a burst of speed, but the first half of the trip is on an incline, so she slows down gradually." So the burst is the very start, then immediately she starts slowing down (uphill) for the first half, then downhill she speeds up, then coasts. So the speed graph would be: rise quickly, fall gradually, rise gradually, then flat. Which graph matches? The right graph: if the initial rise is the first part, but the right graph starts at a high point, falls, then rises, then flat. Oh, maybe the "burst of speed" is reaching an initial speed, then slowing down (so the graph starts at 0, goes up, then down, then up, then flat). But the given graphs: the right graph's final part is flat, which is the coastin…

Snap & solve any problem in the app
Get step-by-step solutions on Sovi AI
Photo-based solutions with guided steps
Explore more problems and detailed explanations
The right graph (Time on x-axis, Speed on y-axis, showing initial decrease, then increase, then a flat, steady line)