QUESTION IMAGE
Question
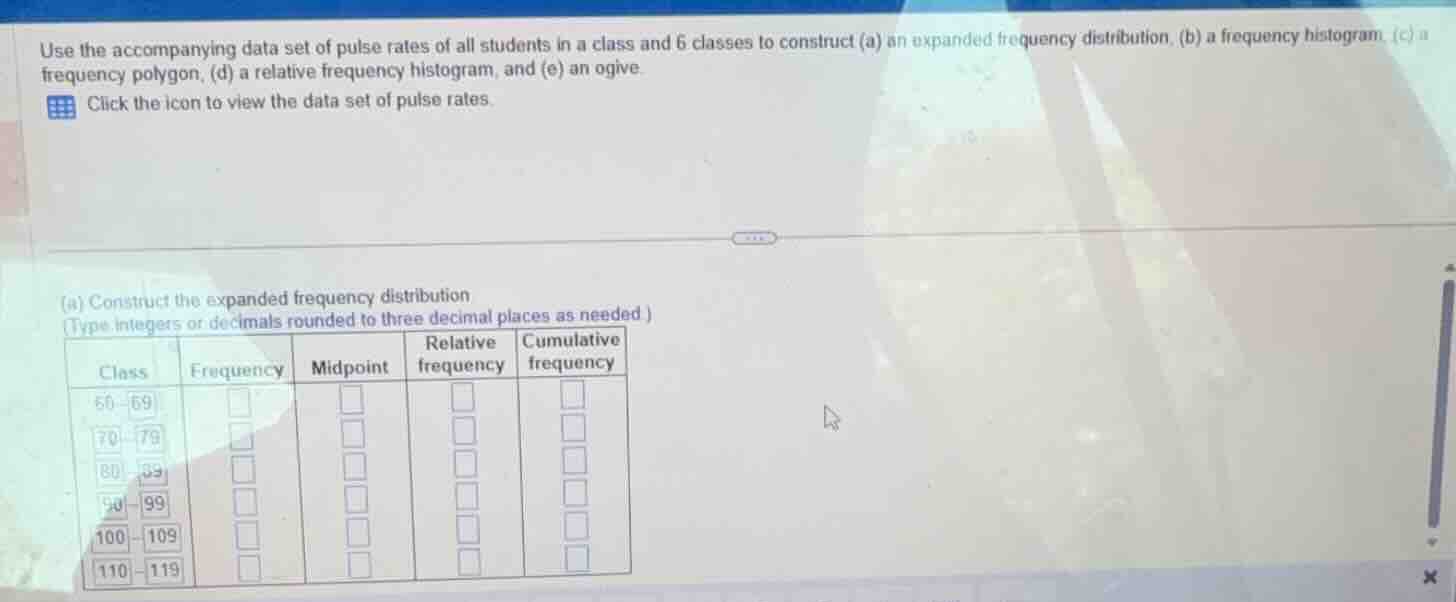
use the accompanying data set of pulse rates of all students in a class and 6 classes to construct (a) an expanded frequency distribution, (b) a frequency histogram, (c) a frequency polygon, (d) a relative frequency histogram, and (e) an ogive. click the icon to view the data set of pulse rates. (a) construct the expanded frequency distribution (type integers or decimals rounded to three decimal places as needed )
To solve this, we first need the data set of pulse rates (which is not provided here, but we'll outline the steps assuming we have the data):
Step 1: Determine Class Width
First, find the range of the data (max - min). Then, divide by the number of classes (6) to get the class width. For example, if the data ranges from 60 to 120, the range is \( 120 - 60 = 60 \), and class width \( \frac{60}{6} = 10 \), which matches the given classes (60 - 69, 70 - 79, etc., each with width 10).
Step 2: Count Frequency for Each Class
Go through the data set and count how many pulse rates fall into each class:
- 60 - 69: Count of data points in this interval.
- 70 - 79: Count of data points in this interval.
- 80 - 89: Count of data points in this interval.
- 90 - 99: Count of data points in this interval.
- 100 - 109: Count of data points in this interval.
- 110 - 119: Count of data points in this interval.
Step 3: Calculate Midpoint for Each Class
Midpoint of a class \( \text{Lower Limit} + \frac{\text{Class Width}}{2} \):
- 60 - 69: \( 60 + \frac{10}{2} = 65 \)
- 70 - 79: \( 70 + \frac{10}{2} = 75 \)
- 80 - 89: \( 80 + \frac{10}{2} = 85 \)
- 90 - 99: \( 90 + \frac{10}{2} = 95 \)
- 100 - 109: \( 100 + \frac{10}{2} = 105 \)
- 110 - 119: \( 110 + \frac{10}{2} = 115 \)
Step 4: Calculate Relative Frequency
Relative Frequency \( = \frac{\text{Frequency of Class}}{\text{Total Number of Data Points}} \)
Step 5: Calculate Cumulative Frequency
Cumulative Frequency for a class is the sum of frequencies of all previous classes (including itself).
Example (Assuming a Sample Data Set)
Suppose the data set has 30 pulse rates with frequencies:
- 60 - 69: 3
- 70 - 79: 5
- 80 - 89: 8
- 90 - 99: 7
- 100 - 109: 4
- 110 - 119: 3
Frequency:
- 60 - 69: 3
- 70 - 79: 5
- 80 - 89: 8
- 90 - 99: 7
- 100 - 109: 4
- 110 - 119: 3
Midpoint:
- 60 - 69: 65
- 70 - 79: 75
- 80 - 89: 85
- 90 - 99: 95
- 100 - 109: 105
- 110 - 119: 115
Relative Frequency (Total = 30):
- 60 - 69: \( \frac{3}{30} = 0.100 \)
- 70 - 79: \( \frac{5}{30} \approx 0.167 \)
- 80 - 89: \( \frac{8}{30} \approx 0.267 \)
- 90 - 99: \( \frac{7}{30} \approx 0.233 \)
- 100 - 109: \( \frac{4}{30} \approx 0.133 \)
- 110 - 119: \( \frac{3}{30} = 0.100 \)
Cumulative Frequency:
- 60 - 69: 3
- 70 - 79: \( 3 + 5 = 8 \)
- 80 - 89: \( 8 + 8 = 16 \)
- 90 - 99: \( 16 + 7 = 23 \)
- 100 - 109: \( 23 + 4 = 27 \)
- 110 - 119: \( 27 + 3 = 30 \)
Final Expanded Frequency Distribution (Using Sample Data)
| Class | Frequency | Midpoint | Relative Frequency | Cumulative Frequency |
|---|---|---|---|---|
| 70 - 79 | 5 | 75 | 0.167 | 8 |
| 80 - 89 | 8 | 85 | 0.267 | 16 |
| 90 - 99 | 7 | 95 | 0.233 | 23 |
| 100 - 109 | 4 | 105 | 0.133 | 27 |
| 110 - 119 | 3 | 115 | 0.100 | 30 |
Note
Since the actual data set is not provided, you need to use the given pulse rate data to count frequencies, then compute midpoints, relative frequencies, and cumulative frequencies following the steps above.
If you provide the data set, we can compute the exact values for each column.

Snap & solve any problem in the app
Get step-by-step solutions on Sovi AI
Photo-based solutions with guided steps
Explore more problems and detailed explanations
To solve this, we first need the data set of pulse rates (which is not provided here, but we'll outline the steps assuming we have the data):
Step 1: Determine Class Width
First, find the range of the data (max - min). Then, divide by the number of classes (6) to get the class width. For example, if the data ranges from 60 to 120, the range is \( 120 - 60 = 60 \), and class width \( \frac{60}{6} = 10 \), which matches the given classes (60 - 69, 70 - 79, etc., each with width 10).
Step 2: Count Frequency for Each Class
Go through the data set and count how many pulse rates fall into each class:
- 60 - 69: Count of data points in this interval.
- 70 - 79: Count of data points in this interval.
- 80 - 89: Count of data points in this interval.
- 90 - 99: Count of data points in this interval.
- 100 - 109: Count of data points in this interval.
- 110 - 119: Count of data points in this interval.
Step 3: Calculate Midpoint for Each Class
Midpoint of a class \( \text{Lower Limit} + \frac{\text{Class Width}}{2} \):
- 60 - 69: \( 60 + \frac{10}{2} = 65 \)
- 70 - 79: \( 70 + \frac{10}{2} = 75 \)
- 80 - 89: \( 80 + \frac{10}{2} = 85 \)
- 90 - 99: \( 90 + \frac{10}{2} = 95 \)
- 100 - 109: \( 100 + \frac{10}{2} = 105 \)
- 110 - 119: \( 110 + \frac{10}{2} = 115 \)
Step 4: Calculate Relative Frequency
Relative Frequency \( = \frac{\text{Frequency of Class}}{\text{Total Number of Data Points}} \)
Step 5: Calculate Cumulative Frequency
Cumulative Frequency for a class is the sum of frequencies of all previous classes (including itself).
Example (Assuming a Sample Data Set)
Suppose the data set has 30 pulse rates with frequencies:
- 60 - 69: 3
- 70 - 79: 5
- 80 - 89: 8
- 90 - 99: 7
- 100 - 109: 4
- 110 - 119: 3
Frequency:
- 60 - 69: 3
- 70 - 79: 5
- 80 - 89: 8
- 90 - 99: 7
- 100 - 109: 4
- 110 - 119: 3
Midpoint:
- 60 - 69: 65
- 70 - 79: 75
- 80 - 89: 85
- 90 - 99: 95
- 100 - 109: 105
- 110 - 119: 115
Relative Frequency (Total = 30):
- 60 - 69: \( \frac{3}{30} = 0.100 \)
- 70 - 79: \( \frac{5}{30} \approx 0.167 \)
- 80 - 89: \( \frac{8}{30} \approx 0.267 \)
- 90 - 99: \( \frac{7}{30} \approx 0.233 \)
- 100 - 109: \( \frac{4}{30} \approx 0.133 \)
- 110 - 119: \( \frac{3}{30} = 0.100 \)
Cumulative Frequency:
- 60 - 69: 3
- 70 - 79: \( 3 + 5 = 8 \)
- 80 - 89: \( 8 + 8 = 16 \)
- 90 - 99: \( 16 + 7 = 23 \)
- 100 - 109: \( 23 + 4 = 27 \)
- 110 - 119: \( 27 + 3 = 30 \)
Final Expanded Frequency Distribution (Using Sample Data)
| Class | Frequency | Midpoint | Relative Frequency | Cumulative Frequency |
|---|---|---|---|---|
| 70 - 79 | 5 | 75 | 0.167 | 8 |
| 80 - 89 | 8 | 85 | 0.267 | 16 |
| 90 - 99 | 7 | 95 | 0.233 | 23 |
| 100 - 109 | 4 | 105 | 0.133 | 27 |
| 110 - 119 | 3 | 115 | 0.100 | 30 |
Note
Since the actual data set is not provided, you need to use the given pulse rate data to count frequencies, then compute midpoints, relative frequencies, and cumulative frequencies following the steps above.
If you provide the data set, we can compute the exact values for each column.