QUESTION IMAGE
Question
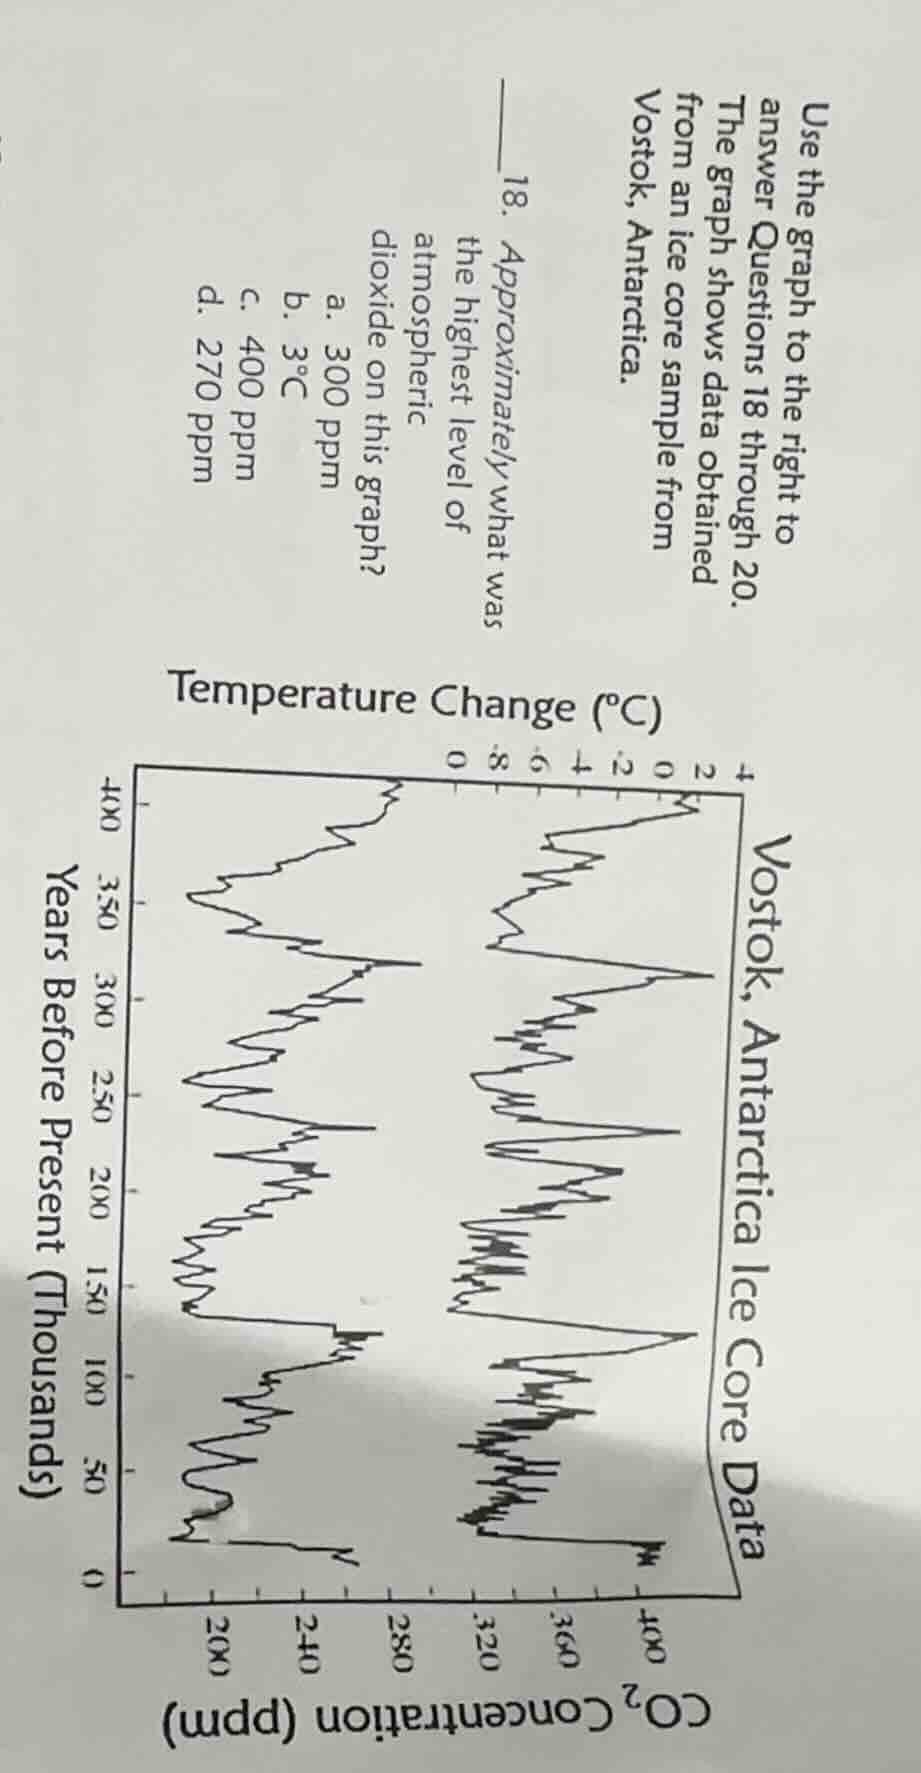
use the graph to the right to answer questions 18 through 20. the graph shows data obtained from an ice core sample from vostok, antarctica.
- approximately what was the highest level of atmospheric dioxide on this graph?
a. 300 ppm
b. 3℃
c. 400 ppm
d. 270 ppm
vostok, antarctica ice core data
temperature change (℃)
years before present (thousands)
co₂ concentration (ppm)
Step1: Locate CO₂ axis max
Identify the highest peak on the bottom axis (CO₂ Concentration in ppm).
Step2: Match peak to option
The peak reaches ~300 ppm, matching option a.

Snap & solve any problem in the app
Get step-by-step solutions on Sovi AI
Photo-based solutions with guided steps
Explore more problems and detailed explanations
a. 300 ppm