QUESTION IMAGE
Question
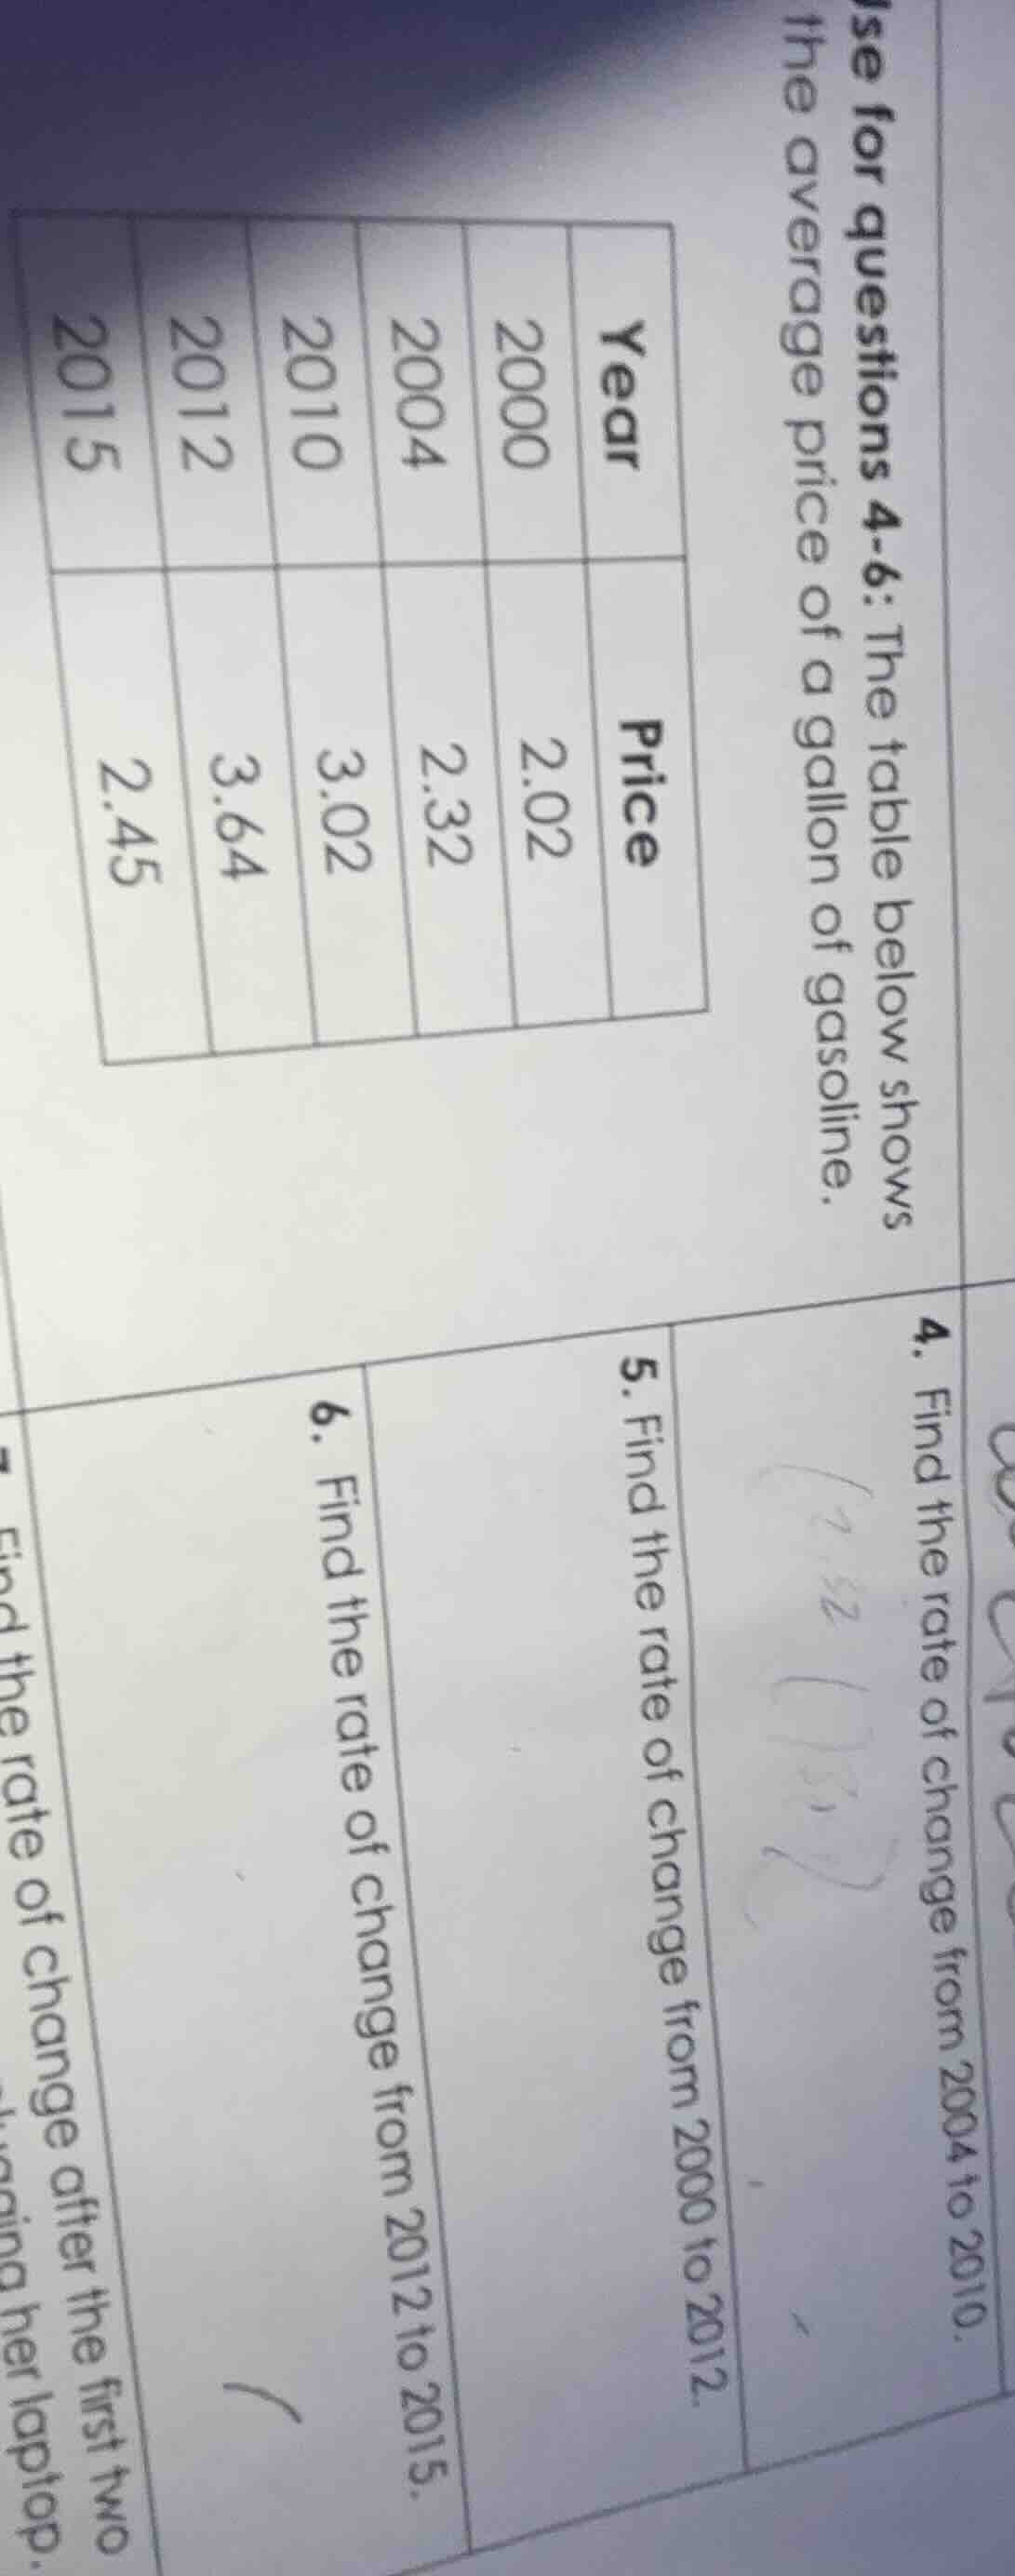
use for questions 4-6: the table below shows the average price of a gallon of gasoline.
| year | 2000 | 2004 | 2010 | 2012 | 2015 |
|---|
- find the rate of change from 2004 to 2010.
- find the rate of change from 2000 to 2012.
- find the rate of change from 2012 to 2015.
Step1: Q4: Identify price/year values
2004: $2.32$, 2010: $3.02$; $\Delta t=2010-2004=6$, $\Delta p=3.02-2.32=0.70$
Step2: Q4: Calculate rate of change
$\text{Rate} = \frac{\Delta p}{\Delta t} = \frac{0.70}{6} \approx 0.12$
Step3: Q5: Identify price/year values
2000: $2.02$, 2012: $3.64$; $\Delta t=2012-2000=12$, $\Delta p=3.64-2.02=1.62$
Step4: Q5: Calculate rate of change
$\text{Rate} = \frac{\Delta p}{\Delta t} = \frac{1.62}{12} = 0.135$
Step5: Q6: Identify price/year values
2012: $3.64$, 2015: $2.45$; $\Delta t=2015-2012=3$, $\Delta p=2.45-3.64=-1.19$
Step6: Q6: Calculate rate of change
$\text{Rate} = \frac{\Delta p}{\Delta t} = \frac{-1.19}{3} \approx -0.40$

Snap & solve any problem in the app
Get step-by-step solutions on Sovi AI
Photo-based solutions with guided steps
Explore more problems and detailed explanations
- $\approx 0.12$ dollars per year
- $0.135$ dollars per year
- $\approx -0.40$ dollars per year