QUESTION IMAGE
Question
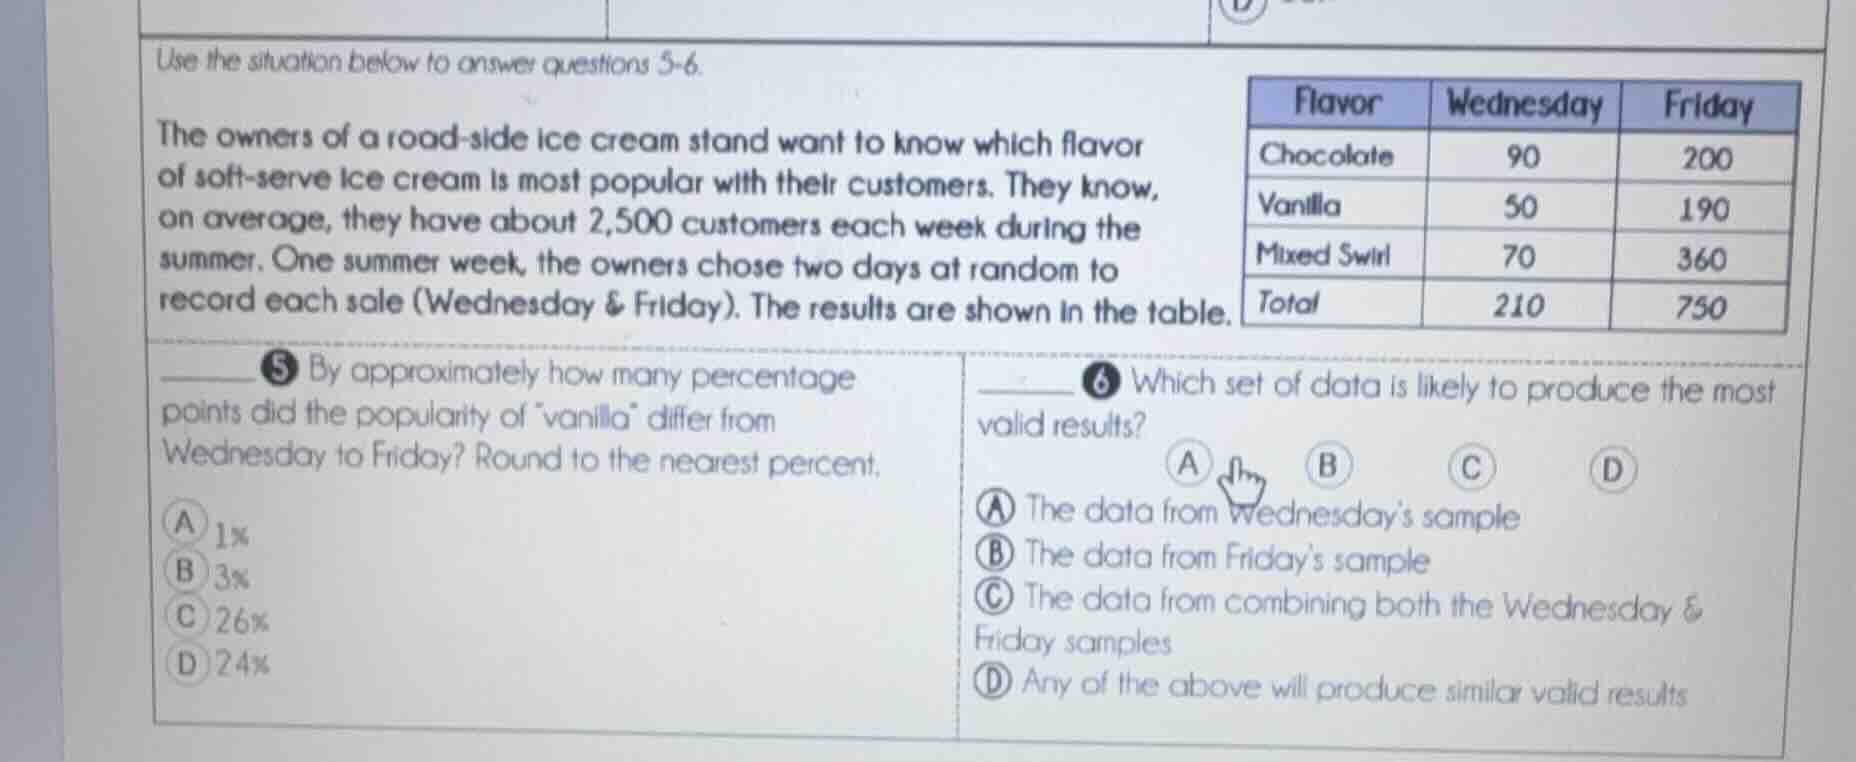
use the situation below to answer questions 5-6.
the owners of a road-side ice cream stand want to know which flavor of soft-serve ice cream is most popular with their customers. they know, on average, they have about 2,500 customers each week during the summer. one summer week, the owners chose two days at random to record each sale (wednesday & friday). the results are shown in the table.
5 by approximately how many percentage points did the popularity of \vanilla\ differ from wednesday to friday? round to the nearest percent.
a 1%
b 3%
c 26%
d 24%
6 which set of data is likely to produce the most valid results?
a the data from wednesdays sample
b the data from fridays sample
c the data from combining both the wednesday & friday samples
d any of the above will produce similar valid results
For Question 5:
Step1: Calculate Wed vanilla popularity
$\text{Wednesday Vanilla \%} = \frac{50}{210} \times 100 \approx 23.81\%$
Step2: Calculate Fri vanilla popularity
$\text{Friday Vanilla \%} = \frac{190}{750} \times 100 \approx 25.33\%$
Step3: Find percentage difference
$|25.33\% - 23.81\%| \approx 1\%$
Larger, combined sample sizes reduce sampling bias and increase the representativeness of data, leading to more valid results for estimating overall customer preferences.

Snap & solve any problem in the app
Get step-by-step solutions on Sovi AI
Photo-based solutions with guided steps
Explore more problems and detailed explanations
A. 1%
---