QUESTION IMAGE
Question
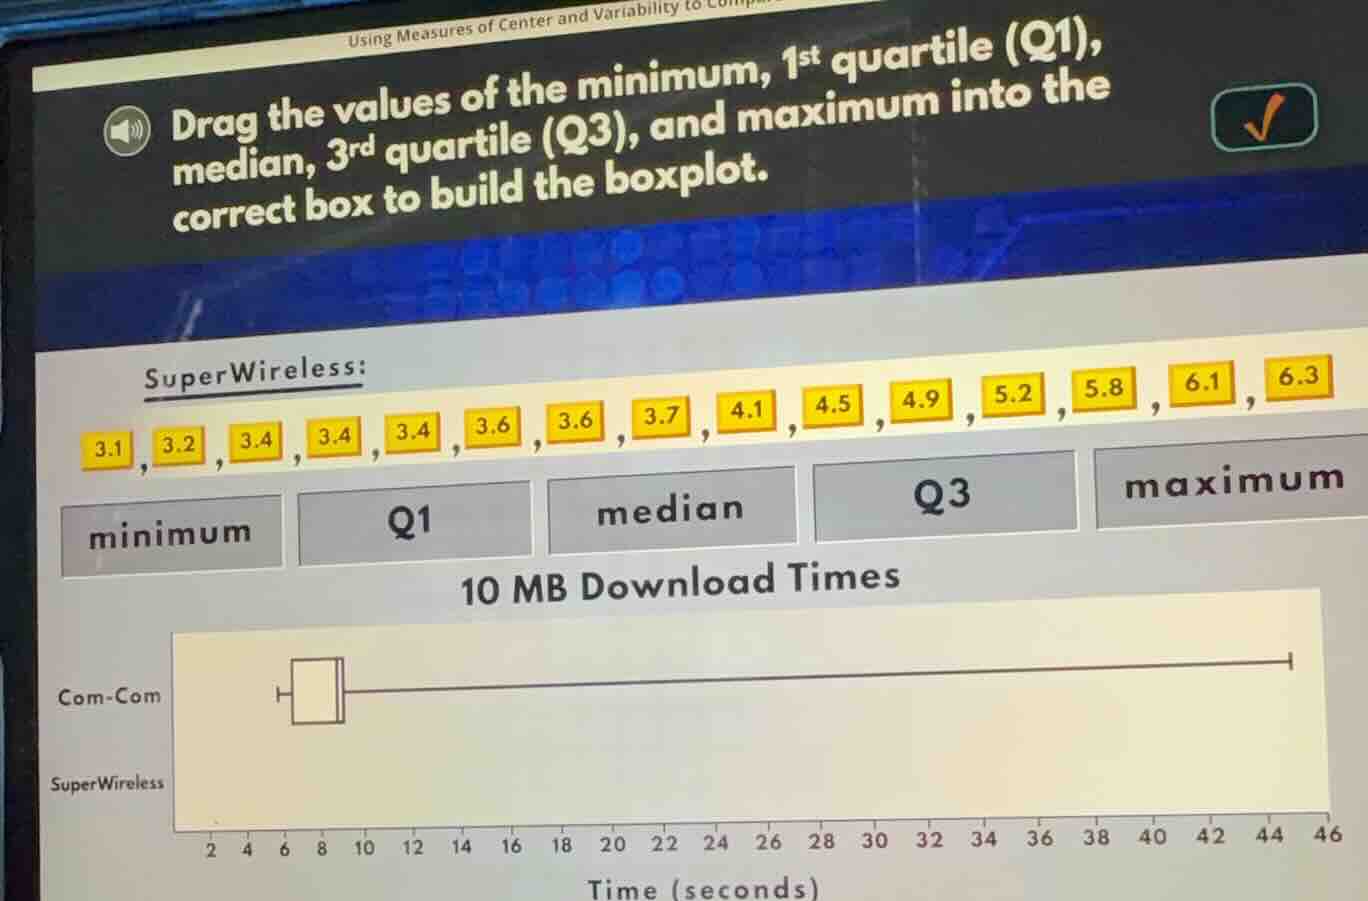
using measures of center and variability to drag the values of the minimum, 1st quartile (q1), median, 3rd quartile (q3), and maximum into the correct box to build the boxplot. superwireless: 3.1, 3.2, 3.4, 3.4, 3.4, 3.6, 3.6, 3.7, 4.1, 4.5, 4.9, 5.2, 5.8, 6.1, 6.3 minimum q1 median q3 maximum 10 mb download times com-com superwireless time (seconds)
Step1: Identify minimum value
The smallest value in the dataset is the first value when sorted: $3.1$
Step2: Calculate Q1 (1st quartile)
The dataset has $n=15$ values. The position of Q1 is $\frac{n+1}{4} = \frac{15+1}{4}=4$. The 4th value in the sorted list is $3.4$.
Step3: Calculate median
The position of the median is $\frac{n+1}{2} = \frac{15+1}{2}=8$. The 8th value in the sorted list is $3.7$.
Step4: Calculate Q3 (3rd quartile)
The position of Q3 is $\frac{3(n+1)}{4} = \frac{3(15+1)}{4}=12$. The 12th value in the sorted list is $5.2$.
Step5: Identify maximum value
The largest value in the dataset is the last value when sorted: $6.3$

Snap & solve any problem in the app
Get step-by-step solutions on Sovi AI
Photo-based solutions with guided steps
Explore more problems and detailed explanations
minimum: $3.1$
Q1: $3.4$
median: $3.7$
Q3: $5.2$
maximum: $6.3$