QUESTION IMAGE
Question
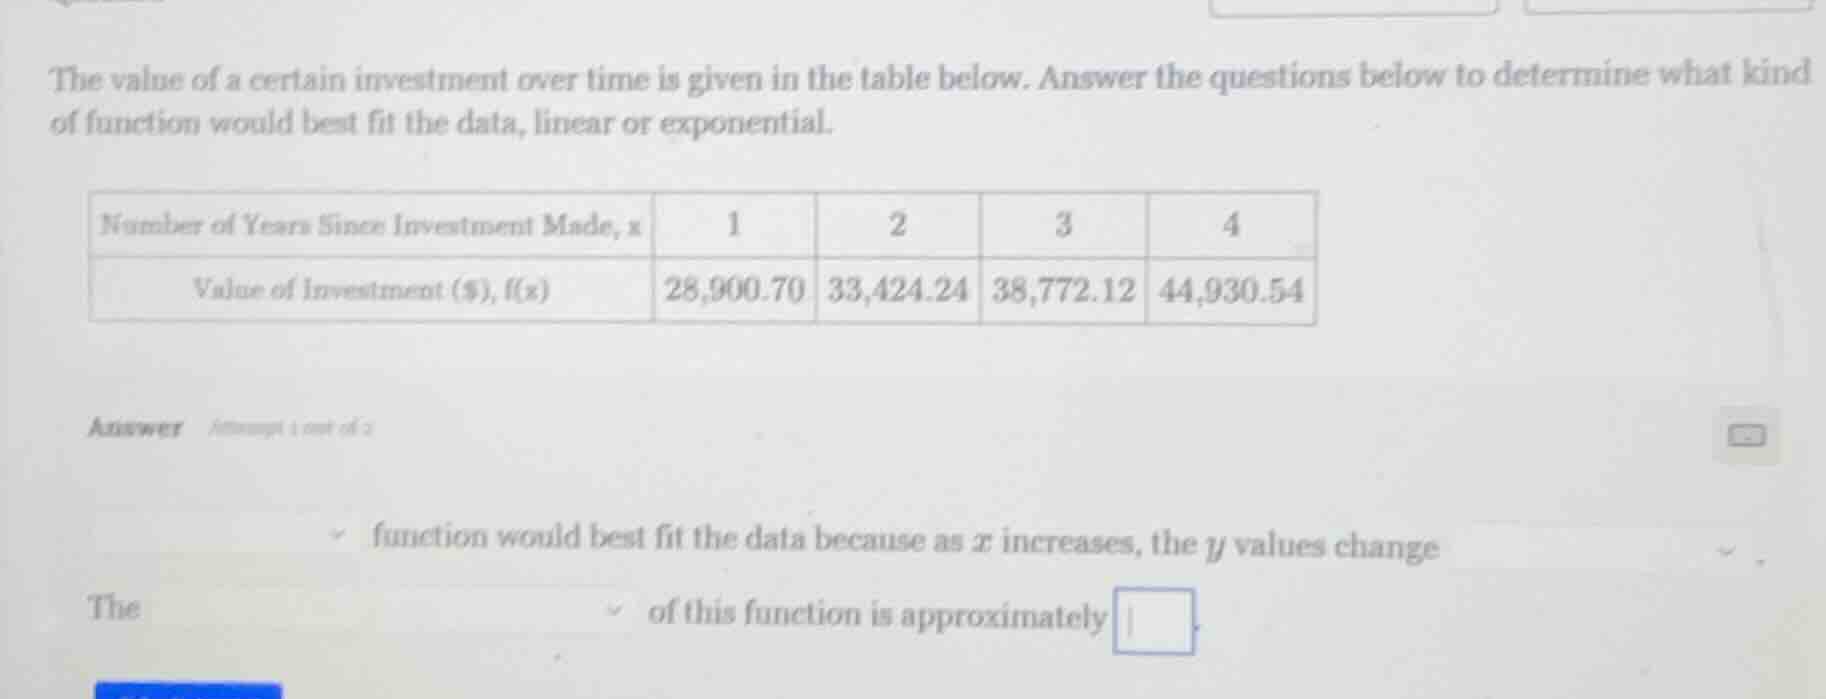
the value of a certain investment over time is given in the table below. answer the questions below to determine what kind of function would best fit the data, linear or exponential.
number of years since investment made, $x$: 1, 2, 3, 4
value of investment ($), $f(x)$: 28,900.70, 33,424.24, 38,772.12, 44,930.54
answer
the __ function would best fit the data because as $x$ increases, the $y$ values change of this function is approximately __.
Step1: Check linear differences
Calculate the differences between consecutive $f(x)$ values:
$33,424.24 - 28,900.70 = 4,523.54$
$38,772.12 - 33,424.24 = 5,347.88$
$44,930.54 - 38,772.12 = 6,158.42$
Step2: Check exponential ratios
Calculate the ratios of consecutive $f(x)$ values:
$\frac{33,424.24}{28,900.70} \approx 1.1565$
$\frac{38,772.12}{33,424.24} \approx 1.1600$
$\frac{44,930.54}{38,772.12} \approx 1.1588$
Step3: Identify best fit type
The ratios are nearly constant, while linear differences vary significantly.
Step4: Calculate average growth factor
Find the average of the ratios:
$\frac{1.1565 + 1.1600 + 1.1588}{3} \approx 1.1584$

Snap & solve any problem in the app
Get step-by-step solutions on Sovi AI
Photo-based solutions with guided steps
Explore more problems and detailed explanations
The exponential function would best fit the data because as $x$ increases, the $y$ values change by a nearly constant multiplicative factor.
The growth factor of this function is approximately $\boldsymbol{1.16}$ (or 15.8% as a percentage, rounded to two decimal places).