QUESTION IMAGE
Question
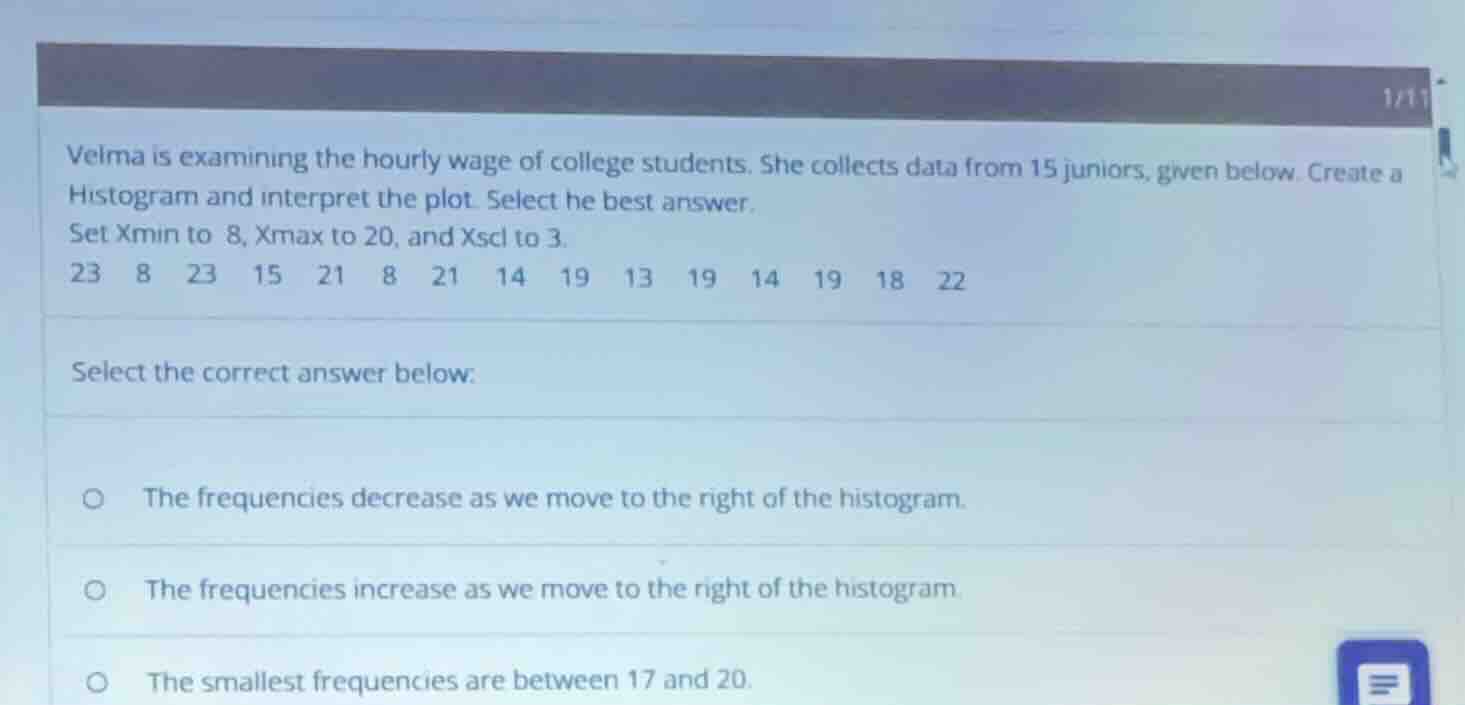
velma is examining the hourly wage of college students. she collects data from 15 juniors, given below. create a histogram and interpret the plot. select he best answer. set xmin to 8, xmax to 20, and xscl to 3. 23 8 23 15 21 8 21 14 19 13 19 14 19 18 22 select the correct answer below. the frequencies decrease as we move to the right of the histogram. the frequencies increase as we move to the right of the histogram. the smallest frequencies are between 17 and 20.
Step1: Determine the classes
Given \( X_{\text{min}} = 8 \), \( X_{\text{max}} = 20 \), and \( X_{\text{scl}} = 3 \), the classes are:
- Class 1: \( 8 - 10 \) (since \( 8+3 - 1=10 \))
- Class 2: \( 11 - 13 \)
- Class 3: \( 14 - 16 \)
- Class 4: \( 17 - 19 \)
- Class 5: \( 20 - 22 \) (but our \( X_{\text{max}} \) is 20, so it's \( 20 - 22 \) but we check data within \( 8 - 20 \))
Step2: Count frequencies for each class
- Class \( 8 - 10 \): Data points are 8, 8. So frequency \( f_1 = 2 \)
- Class \( 11 - 13 \): Data point is 13. So frequency \( f_2 = 1 \)
- Class \( 14 - 16 \): Data points are 15, 14, 14. So frequency \( f_3 = 3 \)
- Class \( 17 - 19 \): Data points are 19, 19, 19, 18. So frequency \( f_4 = 4 \)
- Class \( 20 - 22 \): Data points within \( 20 - 22 \) (but \( X_{\text{max}} = 20 \), our data has 21,23 etc. but we consider up to 20. Wait, original data has 21,23 which are above 20, but we set \( X_{\text{max}} = 20 \), so we ignore data above 20? Wait no, the problem says "Set \( X_{\text{min}} \) to 8, \( X_{\text{max}} \) to 20, and \( X_{\text{scl}} \) to 3". So we consider data in [8,20]. So data above 20 (21,23,21,22) are outside our \( X_{\text{max}} = 20 \), so we exclude them? Wait no, maybe the problem has a typo, but let's proceed with given \( X_{\text{max}} = 20 \). Wait, original data: 23, 8, 23, 15, 21, 8, 21, 14, 19, 13, 19, 14, 19, 18, 22. But we take \( X_{\text{max}} = 20 \), so we consider data ≤20: 8, 8, 15, 14, 19, 13, 19, 14, 19, 18. Wait, no, the 15 juniors: wait the data given is 15 numbers? Wait the data is: 23, 8, 23, 15, 21, 8, 21, 14, 19, 13, 19, 14, 19, 18, 22. That's 15 numbers. But we set \( X_{\text{max}} = 20 \), so data points above 20: 23,23,21,21,22. So we have 15 - 5 = 10 data points within [8,20]? Wait no, let's list data within [8,20]: 8,8,15,14,19,13,19,14,19,18. Wait that's 10? Wait no, 8,8,15,21 (no,21>20),14,19,13,19,14,19,18,22 (no). Wait I must have miscounted. Let's list all 15 data points:
- 23 (above 20)
- 8 (in)
- 23 (above 20)
- 15 (in)
- 21 (above 20)
- 8 (in)
- 21 (above 20)
- 14 (in)
- 19 (in)
- 13 (in)
- 19 (in)
- 14 (in)
- 19 (in)
- 18 (in)
- 22 (above 20)
So data within [8,20]: 8,8,15,14,19,13,19,14,19,18. Wait that's 10? Wait no, 8 (2),15(1),14(2),19(3),13(1),18(1). Total 2+1+2+3+1+1=10? Wait maybe the problem allows Xmax to 20 but data above 20 are included? No, the problem says "Set Xmin to 8, Xmax to 20, and Xscl to 3". So the x - axis is from 8 to 20 with scale 3. So the classes are 8 - 10, 11 - 13, 14 - 16, 17 - 19, 20 - 22 (but 20 - 22 is beyond Xmax? No, Xmax is 20, so 20 - 22 is 20,21,22 but Xmax is 20, so 20 - 22 is up to 20? Maybe the problem has a mistake, but let's proceed with the data within 8 - 20.
Wait, maybe I made a mistake. Let's re - check the classes:
Class 1: 8 - 10 (8 ≤ x < 11, since Xscl = 3, so 8,9,10)
Class 2: 11 - 13 (11 ≤ x < 14)
Class 3: 14 - 16 (14 ≤ x < 17)
Class 4: 17 - 19 (17 ≤ x < 20)
Class 5: 20 - 22 (20 ≤ x < 23)
Now count frequencies with this correct class interval (using exclusive upper limit):
- Class 8 - 10 (8 ≤ x < 11): Data points 8,8. Frequency = 2
- Class 11 - 13 (11 ≤ x < 14): Data point 13. Frequency = 1
- Class 14 - 16 (14 ≤ x < 17): Data points 15,14,14. Frequency = 3
- Class 17 - 19 (17 ≤ x < 20): Data points 19,19,19,18. Frequency = 4
- Class 20 - 22 (20 ≤ x < 23): Data points 21,21,22 (but 21,22 are in this class, but our Xmax is 20? Wait no, Xmax is 20, but the class 20 - 22 includes 20,21,22. So data points 21,21,22 are in this class. So frequency for class 20 - 22: 3 (21,21,22)…

Snap & solve any problem in the app
Get step-by-step solutions on Sovi AI
Photo-based solutions with guided steps
Explore more problems and detailed explanations
The frequencies increase as we move to the right of the histogram. (The option corresponding to this statement)