QUESTION IMAGE
Question
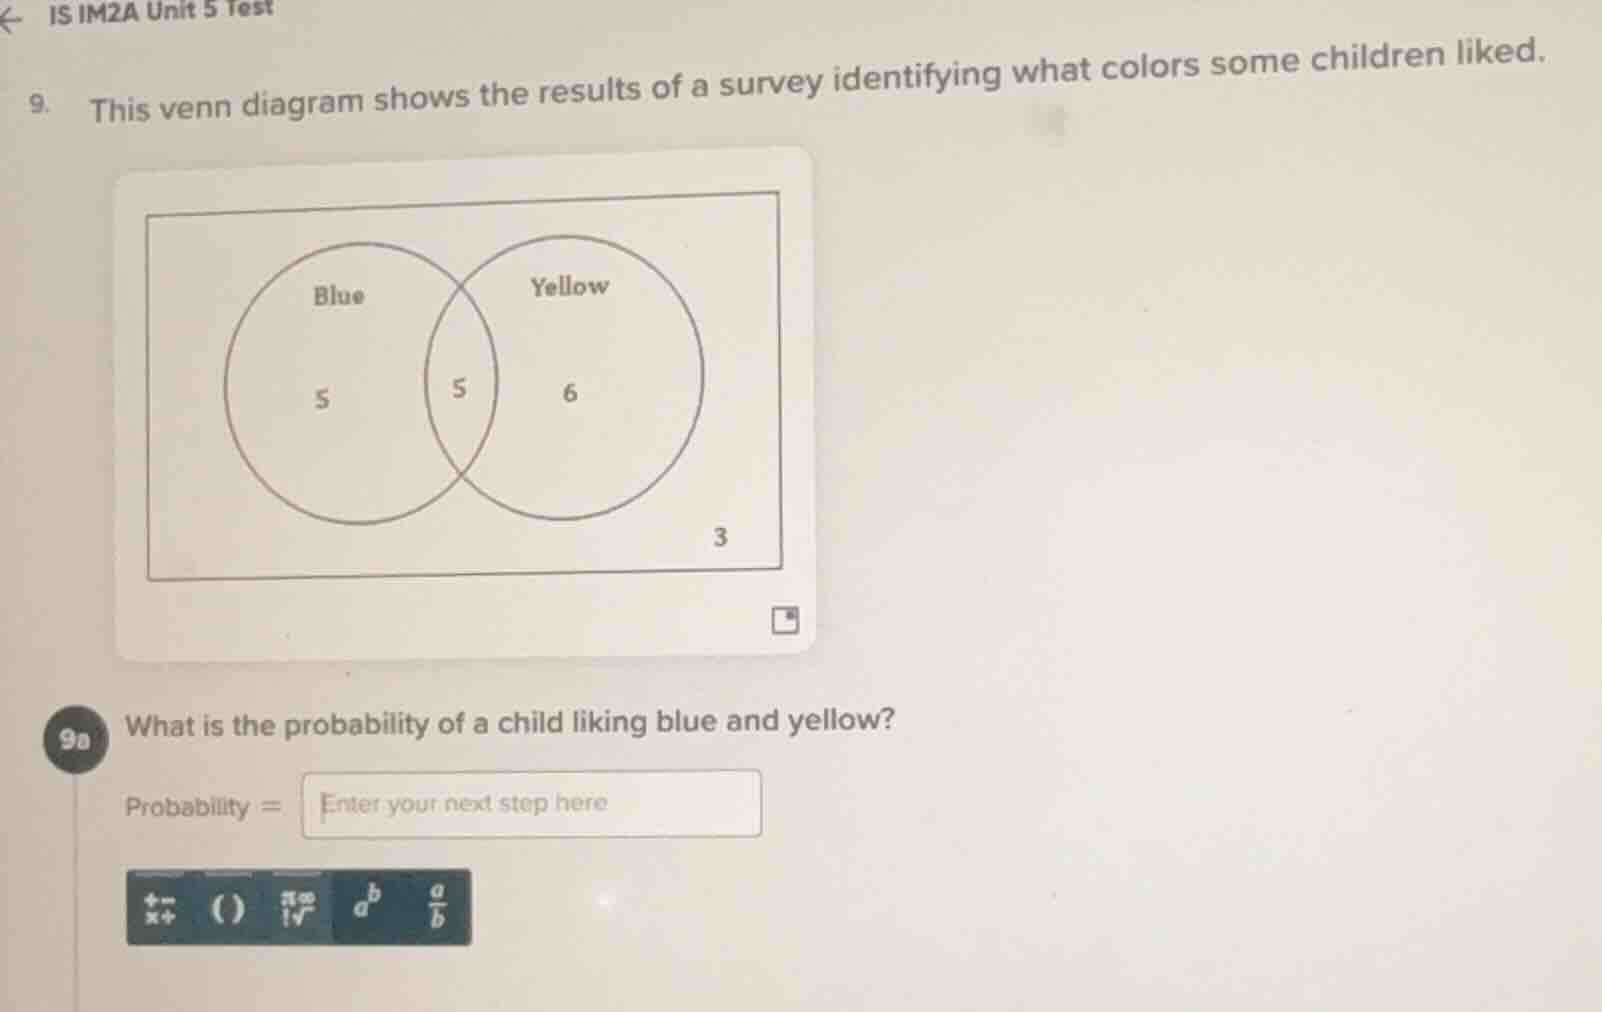
- this venn diagram shows the results of a survey identifying what colors some children liked. 9a what is the probability of a child liking blue and yellow? probability = enter your next step here
Step1: Find total number of children
First, we calculate the total number of children by adding the number of children in each section of the Venn diagram. The sections are: only Blue (5), both Blue and Yellow (5), only Yellow (6), and neither (3). So the total is \(5 + 5 + 6 + 3 = 19\).
Step2: Calculate the probability
The number of children who like both Blue and Yellow is 5. The probability is the number of favorable outcomes (children who like both) divided by the total number of outcomes (total children). So the probability is \(\frac{5}{19}\).

Snap & solve any problem in the app
Get step-by-step solutions on Sovi AI
Photo-based solutions with guided steps
Explore more problems and detailed explanations
\(\frac{5}{19}\)