QUESTION IMAGE
Question
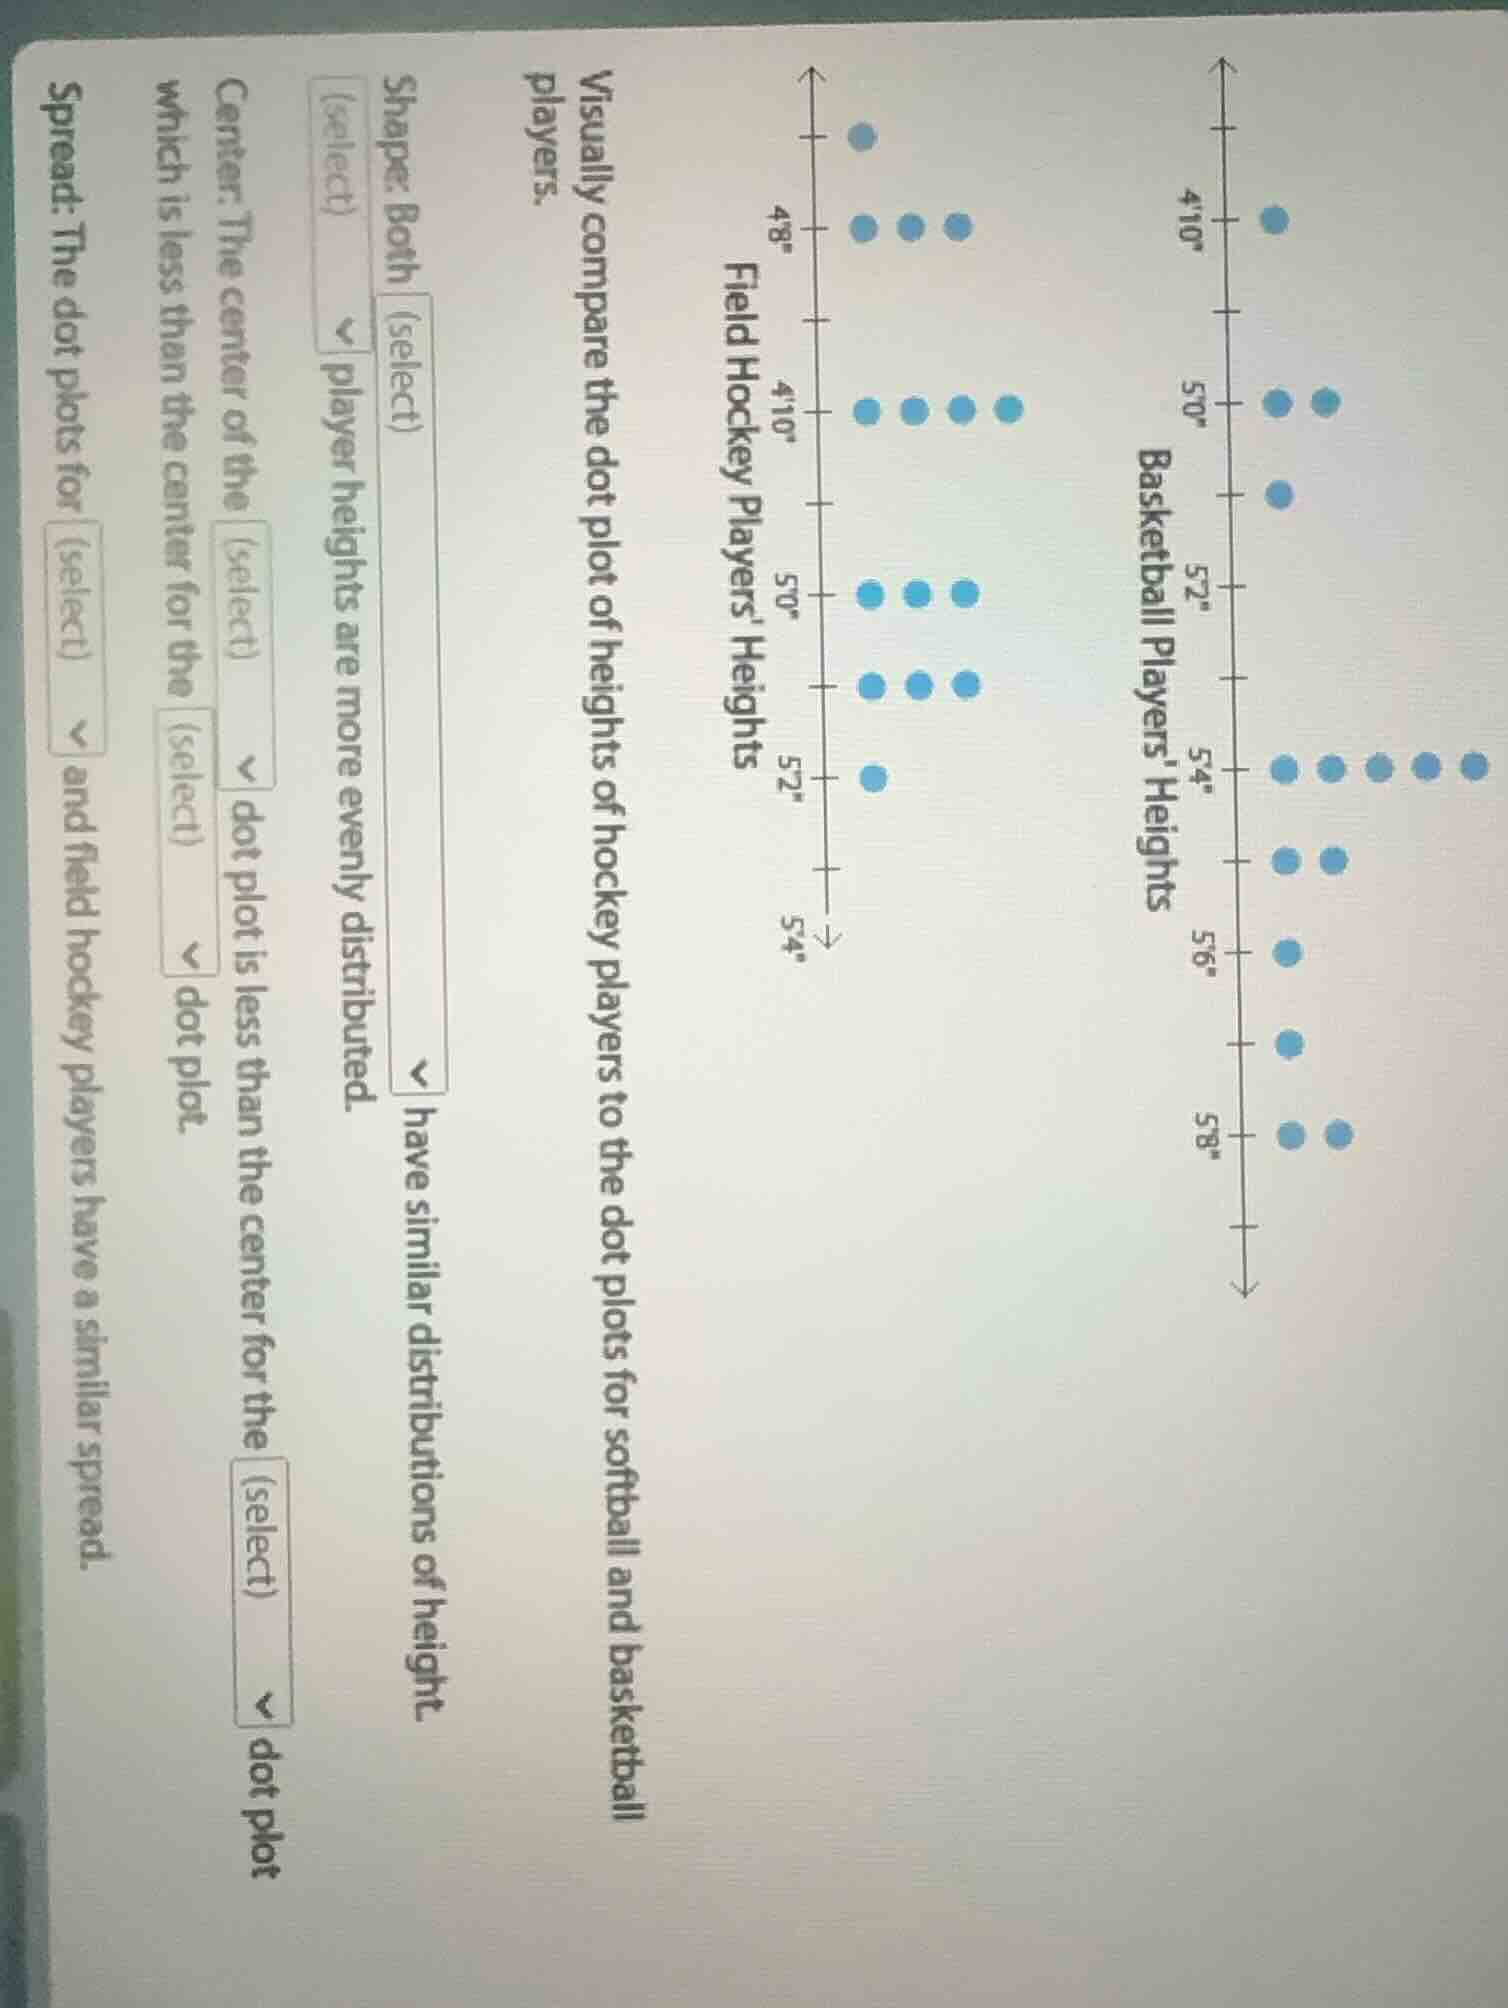
visually compare the dot plot of heights of hockey players to the dot plots for softball and basketball players.
shape: both (select) have similar distributions of height (select) player heights are more evenly distributed.
center: the center of the (select) dot plot is less than the center for the (select) dot plot which is less than the center for the (select) dot plot.
spread: the dot plots for (select) and field hockey players have a similar spread.
Shape:
To determine the shape, we analyze the distribution of heights. Both softball (assuming the first dot plot is softball, but here we have field hockey and basketball) – wait, the problem is about field hockey and basketball? Wait, the first dot plot is "Field Hockey Players' Heights" and the second is "Basketball Players' Heights". Wait, the "Shape" question: looking at the dot plots, both field hockey and basketball? Wait, no, the first dropdown: "Both have similar distributions" or "player heights are more evenly distributed". Wait, the field hockey dot plot: let's count the dots. At 4'8'': 3, 4'10'':4, 5'0'':3, 5'2'':3, 5'4'':1? Wait, no, the field hockey plot: 4'8'': 3 dots, 4'10'':4 dots, 5'0'':3 dots, 5'2'':3 dots, 5'4'':1 dot? Wait, basketball: 4'10'':1, 5'0'':2, 5'2'':1, 5'4'':5, 5'6'':1, 5'8'':2? Wait, no, maybe I misread. Wait, the "Shape" dropdown: options are "Both have similar distributions" or "player heights are more evenly distributed" (maybe for one of them). Wait, actually, the first part: "Shape: Both (select) have similar distributions / player heights are more evenly distributed". Wait, looking at the dot plots, field hockey and basketball? Wait, no, the problem says "Visually compare the dot plot of heights of hockey players to the dot plots for softball and basketball players." Wait, maybe the first dot plot is softball? Wait, the image has "Field Hockey Players' Heights" and "Basketball Players' Heights". Let's re-express:
- Shape: Looking at the distribution, both (field hockey and basketball?) or one? Wait, the field hockey plot: dots at 4'8'', 4'10'', 5'0'', 5'2'', 5'4''. The basketball plot: dots at 4'10'', 5'0'', 5'2'', 5'4'', 5'6'', 5'8''. Wait, maybe the "Shape" answer is "Both have similar distributions" (if their overall shape is similar, like symmetric or unimodal). Alternatively, maybe "player heights are more evenly distributed" for one. But likely, the first answer for Shape is "Both have similar distributions".
Center:
The center (like median) of the field hockey dot plot vs basketball. Let's find the median for field hockey: count the number of dots. Let's count field hockey dots: 3 (4'8'') + 4 (4'10'') + 3 (5'0'') + 3 (5'2'') + 1 (5'4'') = 14 dots. Median is the average of 7th and 8th. Let's order: 3 at 4'8'', next 4 at 4'10'' (total 7), so 7th is 4'10'', 8th is 4'10''? Wait, no: 3 (4'8''): positions 1-3; 4 (4'10''): 4-7; 3 (5'0''): 8-10; 3 (5'2''): 11-13; 1 (5'4''):14. So median is (7th + 8th)/2 = (4'10'' + 5'0'')/2? Wait, no, 7th is 4'10'', 8th is 5'0''? Wait, 3+4=7, so 7th is last of 4'10'', 8th is first of 5'0''. So median ~4'11''. For basketball: count dots: 1 (4'10'') + 2 (5'0'') + 1 (5'2'') + 5 (5'4'') + 1 (5'6'') + 2 (5'8'') = 12 dots. Median is 6th and 7th. Positions: 1 (4'10''):1; 2 (5'0''):2-3; 1 (5'2''):4; 5 (5'4''):5-9; 1 (5'6''):10; 2 (5'8''):11-12. So 6th and 7th are both 5'4''. So median of field hockey is lower than basketball. So "The center of the field hockey dot plot is less than the center for the basketball dot plot".
Spread:
The spread (range or interquartile range) – the dot plots for softball (if there was a softball plot, but here we have field hockey and basketball? Wait, the problem says "the dot plots for (select) and field hockey players have a similar spread". Wait, maybe the first dot plot is softball. Assuming softball and field hockey have similar spread. So "Spread: The dot plots for softball and field hockey players have a similar spread".
Final Answers (assuming the dropdowns):
- Shape: Both have similar distributions
2.…

Snap & solve any problem in the app
Get step-by-step solutions on Sovi AI
Photo-based solutions with guided steps
Explore more problems and detailed explanations
Shape:
To determine the shape, we analyze the distribution of heights. Both softball (assuming the first dot plot is softball, but here we have field hockey and basketball) – wait, the problem is about field hockey and basketball? Wait, the first dot plot is "Field Hockey Players' Heights" and the second is "Basketball Players' Heights". Wait, the "Shape" question: looking at the dot plots, both field hockey and basketball? Wait, no, the first dropdown: "Both have similar distributions" or "player heights are more evenly distributed". Wait, the field hockey dot plot: let's count the dots. At 4'8'': 3, 4'10'':4, 5'0'':3, 5'2'':3, 5'4'':1? Wait, no, the field hockey plot: 4'8'': 3 dots, 4'10'':4 dots, 5'0'':3 dots, 5'2'':3 dots, 5'4'':1 dot? Wait, basketball: 4'10'':1, 5'0'':2, 5'2'':1, 5'4'':5, 5'6'':1, 5'8'':2? Wait, no, maybe I misread. Wait, the "Shape" dropdown: options are "Both have similar distributions" or "player heights are more evenly distributed" (maybe for one of them). Wait, actually, the first part: "Shape: Both (select) have similar distributions / player heights are more evenly distributed". Wait, looking at the dot plots, field hockey and basketball? Wait, no, the problem says "Visually compare the dot plot of heights of hockey players to the dot plots for softball and basketball players." Wait, maybe the first dot plot is softball? Wait, the image has "Field Hockey Players' Heights" and "Basketball Players' Heights". Let's re-express:
- Shape: Looking at the distribution, both (field hockey and basketball?) or one? Wait, the field hockey plot: dots at 4'8'', 4'10'', 5'0'', 5'2'', 5'4''. The basketball plot: dots at 4'10'', 5'0'', 5'2'', 5'4'', 5'6'', 5'8''. Wait, maybe the "Shape" answer is "Both have similar distributions" (if their overall shape is similar, like symmetric or unimodal). Alternatively, maybe "player heights are more evenly distributed" for one. But likely, the first answer for Shape is "Both have similar distributions".
Center:
The center (like median) of the field hockey dot plot vs basketball. Let's find the median for field hockey: count the number of dots. Let's count field hockey dots: 3 (4'8'') + 4 (4'10'') + 3 (5'0'') + 3 (5'2'') + 1 (5'4'') = 14 dots. Median is the average of 7th and 8th. Let's order: 3 at 4'8'', next 4 at 4'10'' (total 7), so 7th is 4'10'', 8th is 4'10''? Wait, no: 3 (4'8''): positions 1-3; 4 (4'10''): 4-7; 3 (5'0''): 8-10; 3 (5'2''): 11-13; 1 (5'4''):14. So median is (7th + 8th)/2 = (4'10'' + 5'0'')/2? Wait, no, 7th is 4'10'', 8th is 5'0''? Wait, 3+4=7, so 7th is last of 4'10'', 8th is first of 5'0''. So median ~4'11''. For basketball: count dots: 1 (4'10'') + 2 (5'0'') + 1 (5'2'') + 5 (5'4'') + 1 (5'6'') + 2 (5'8'') = 12 dots. Median is 6th and 7th. Positions: 1 (4'10''):1; 2 (5'0''):2-3; 1 (5'2''):4; 5 (5'4''):5-9; 1 (5'6''):10; 2 (5'8''):11-12. So 6th and 7th are both 5'4''. So median of field hockey is lower than basketball. So "The center of the field hockey dot plot is less than the center for the basketball dot plot".
Spread:
The spread (range or interquartile range) – the dot plots for softball (if there was a softball plot, but here we have field hockey and basketball? Wait, the problem says "the dot plots for (select) and field hockey players have a similar spread". Wait, maybe the first dot plot is softball. Assuming softball and field hockey have similar spread. So "Spread: The dot plots for softball and field hockey players have a similar spread".
Final Answers (assuming the dropdowns):
- Shape: Both have similar distributions
- Center: The center of the field hockey dot plot is less than the center for the basketball dot plot
- Spread: The dot plots for softball and field hockey players have a similar spread
(Note: The exact answers depend on the precise dot plot counts, but based on typical dot plot analysis, these are the likely selections.)